My Homelab Overview
This is my homelab playground. What started as a few mini PCs on a desk has grown into a full server rack. I recently upgraded to a proper rack setup with dedicated networking, a rackmount server, UPS, and structured cabling. It's my space to mess with Proxmox, AI, Kubernetes, Docker, Linux and whatever new shiny tech catches my eye...
Almost all here was bought used and eBay is my best friend. I like to spend as little as possible, and learn as much as I can on many different platforms.
I started this as a fun side project during lockdown, and it's kinda grown from there. Now I've got it running backups, a media server, CI/CD pipelines, k8s cluster, Local LLM, monitoring dashboards, logs collections, private VPNs etc. I break it, fix it, and learn something new almost every week. Here's what I'm running...
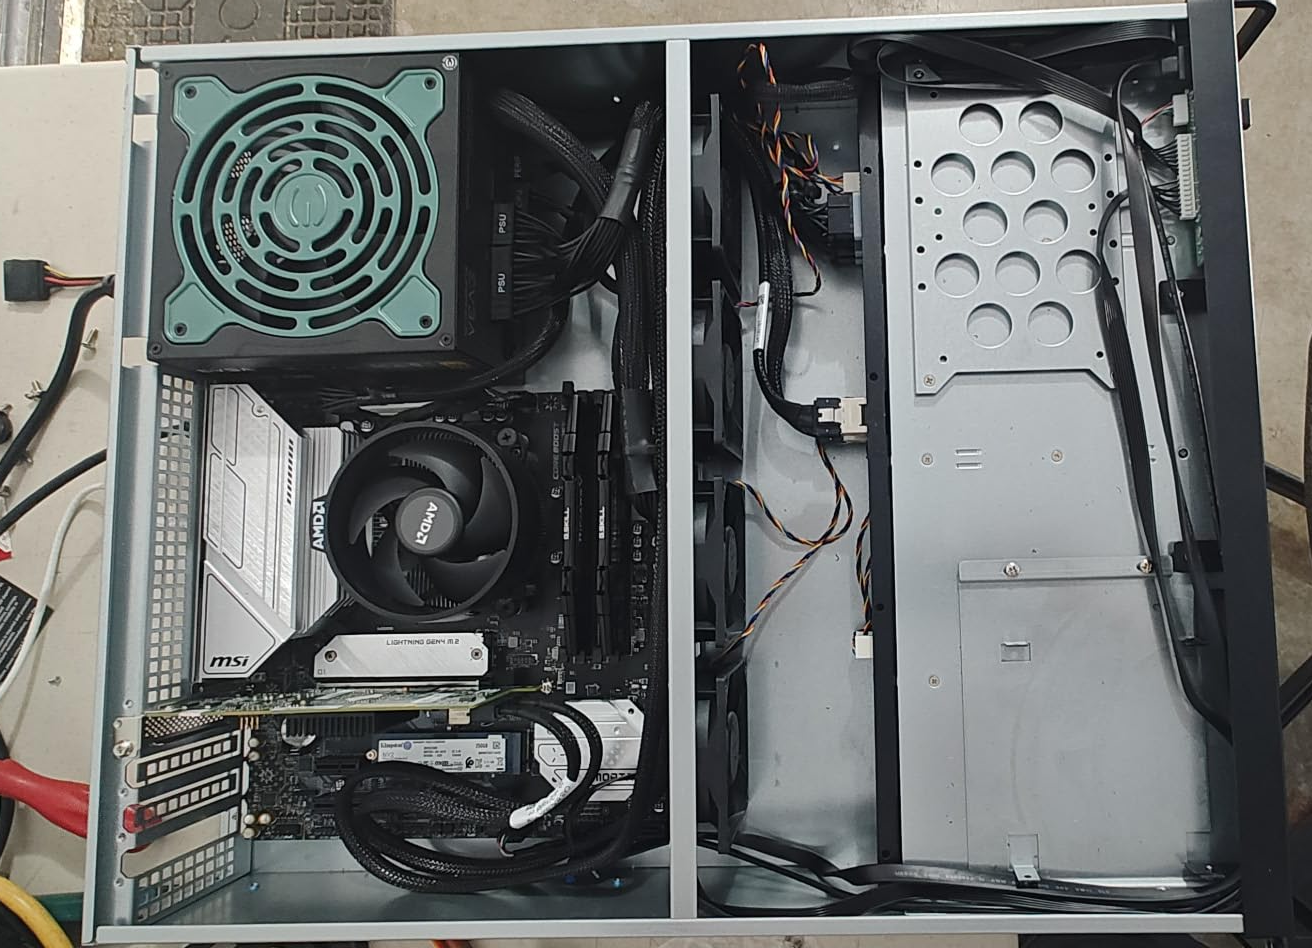
Hardware Setup
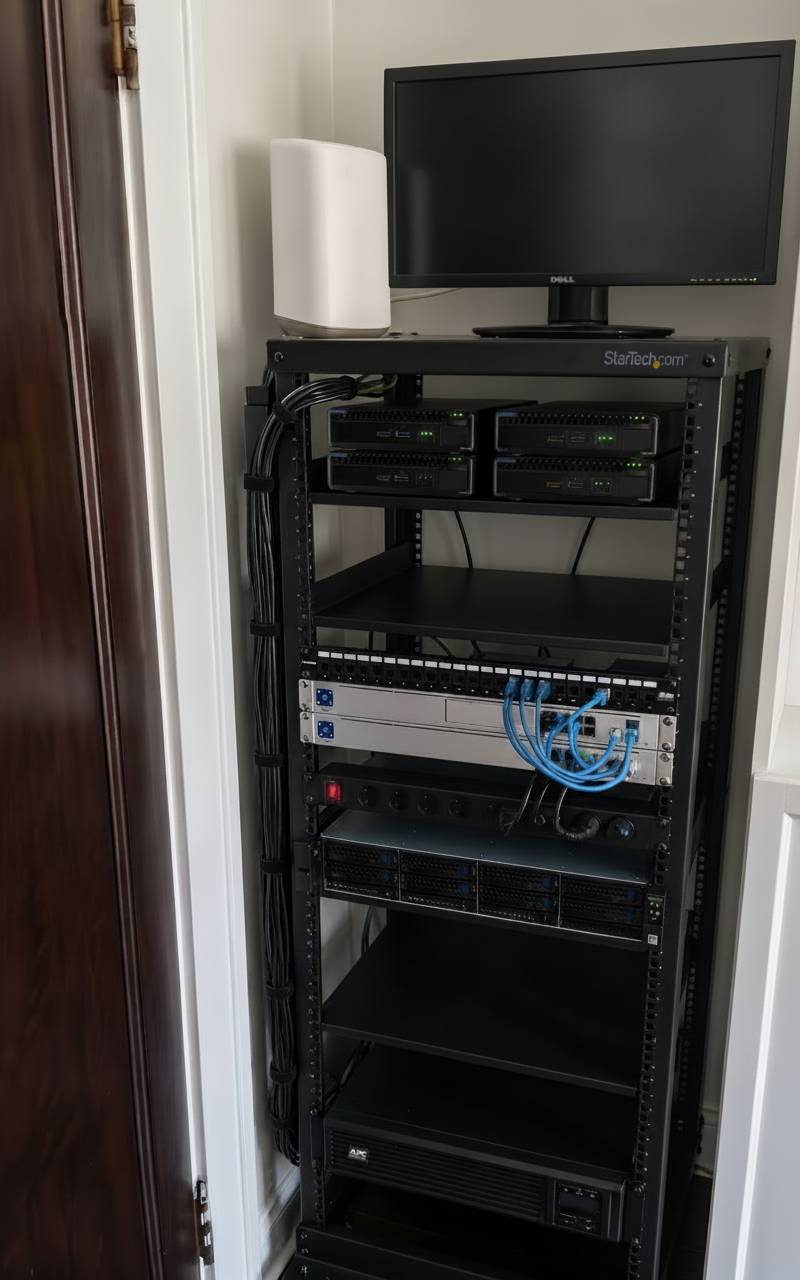
Current Rack Setup
- Server Rack: StarTech.com open-frame rack with vertical cable management and structured cabling
- Dell Monitor: Dell 22" for direct KVM console/Grafana access
- HPE ProLiant Mini Servers (x4): Rack-shelf mounted Proxmox/Kubernetes nodes - 8-core 2.4 GHz (Intel Xeon E5-2630 v3), 32 GB RAM each. Picked up used on eBay, these are upgrade from the old HP EliteDesks.
- Network Switch: Ubiquiti UniFi 24-port 1U managed switch - central network fabric for all rack devices. Handles VLANs to segment Kubernetes pod traffic, storage, and management networks. Port-level visibility and bandwidth monitoring via the UniFi UI.
- Patch Panel: 24-port Cat6 keystone patch panel
- Rackmount Server: RackChoice 2U - 8 x 3.5" hot-swap bays, 6 Gbps, M-ATX/Mini-ITX, 21.5" depth. Primary storage server running TrueNAS with ZFS storage pools, SMB shares, and Proxmox Backup Server targets. Also handles heavier compute workloads (GitLab, Wazuh) that would strain the mini nodes.
- Rack-Mount UPS: APC 1500VA Smart UPS, SMC1500 Rack Mount UPS AVR, 120V
- Mesh WiFi Node: Xfinity mesh access point
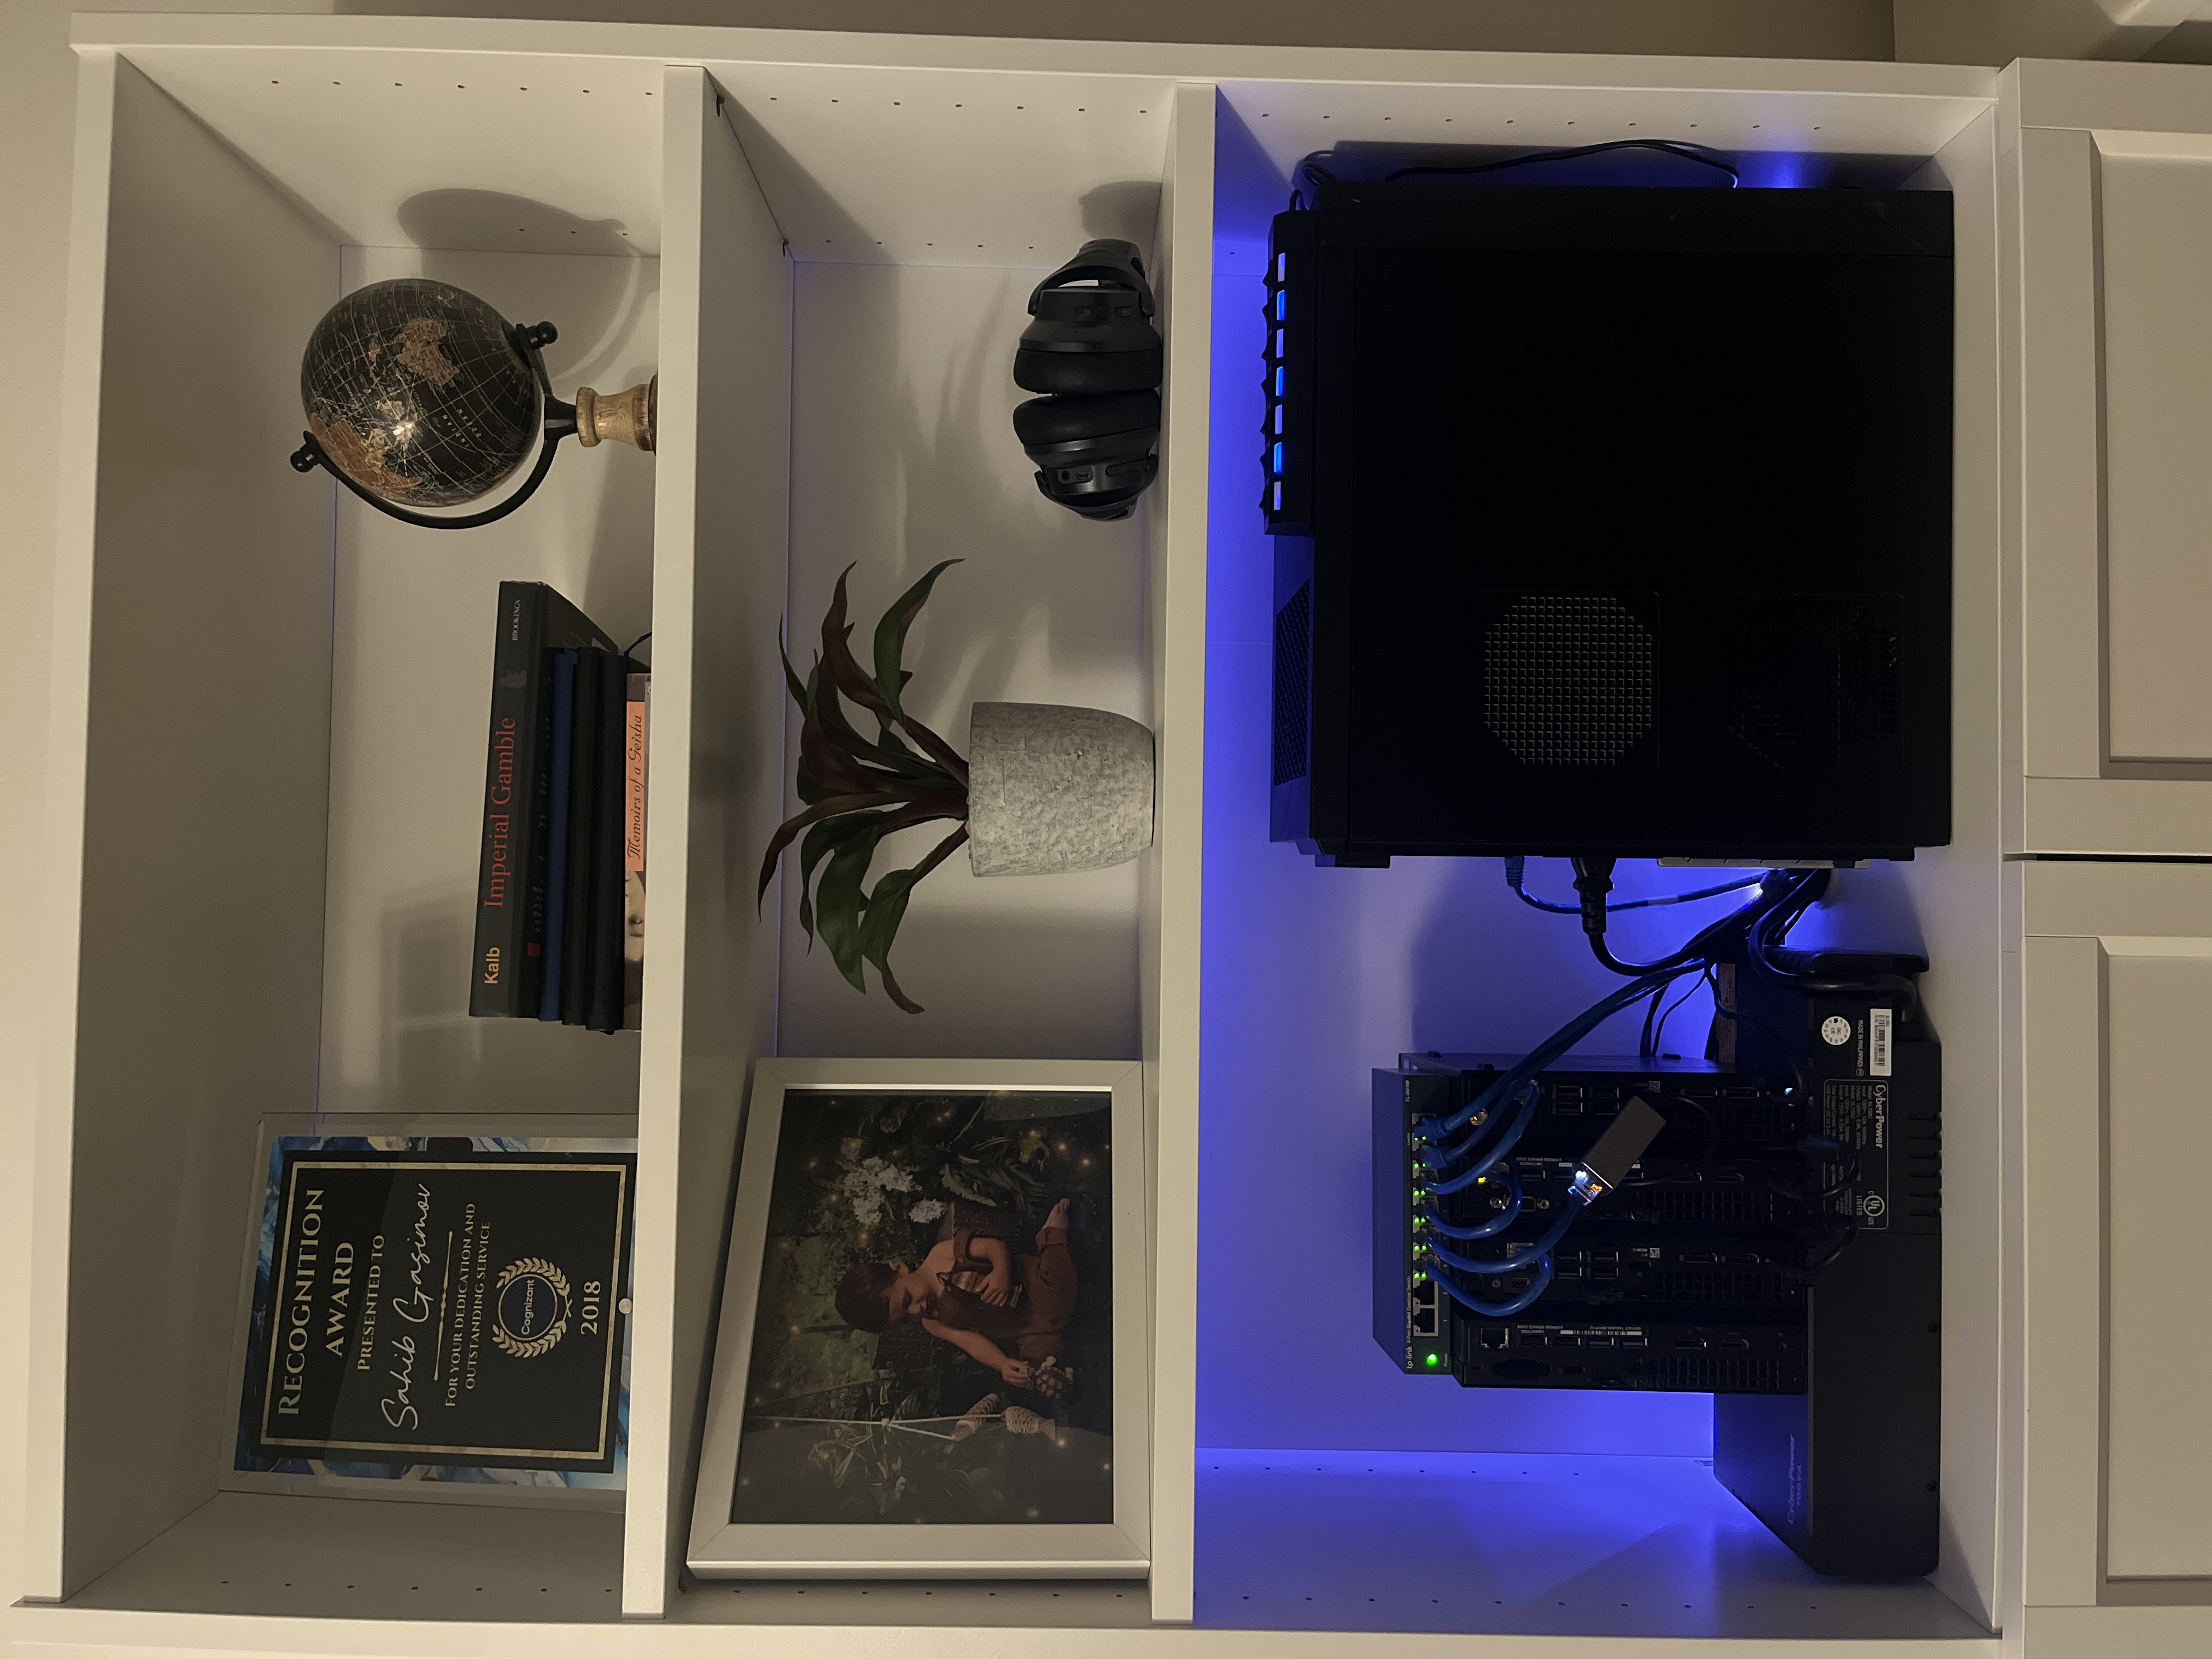
Additional Nodes
- AI / Proxmox node: Dell Precision Tower 3630 with 48GB RAM and an NVIDIA GTX 3060 GPU. This node runs Ollama, Open WebUI, and Paperless-NGX AI processing. See the full write-up in my Local AI with Ollama on Proxmox article.
- Proxmox backup server (PBS): Dell OptiPlex 5050 Mini
- Dell OptiPlex 7070 Mini (x3) 16 GB RAM each: A separate Proxmox cluster that I run for a volunteer charity community project.
What's actually running on my home lab
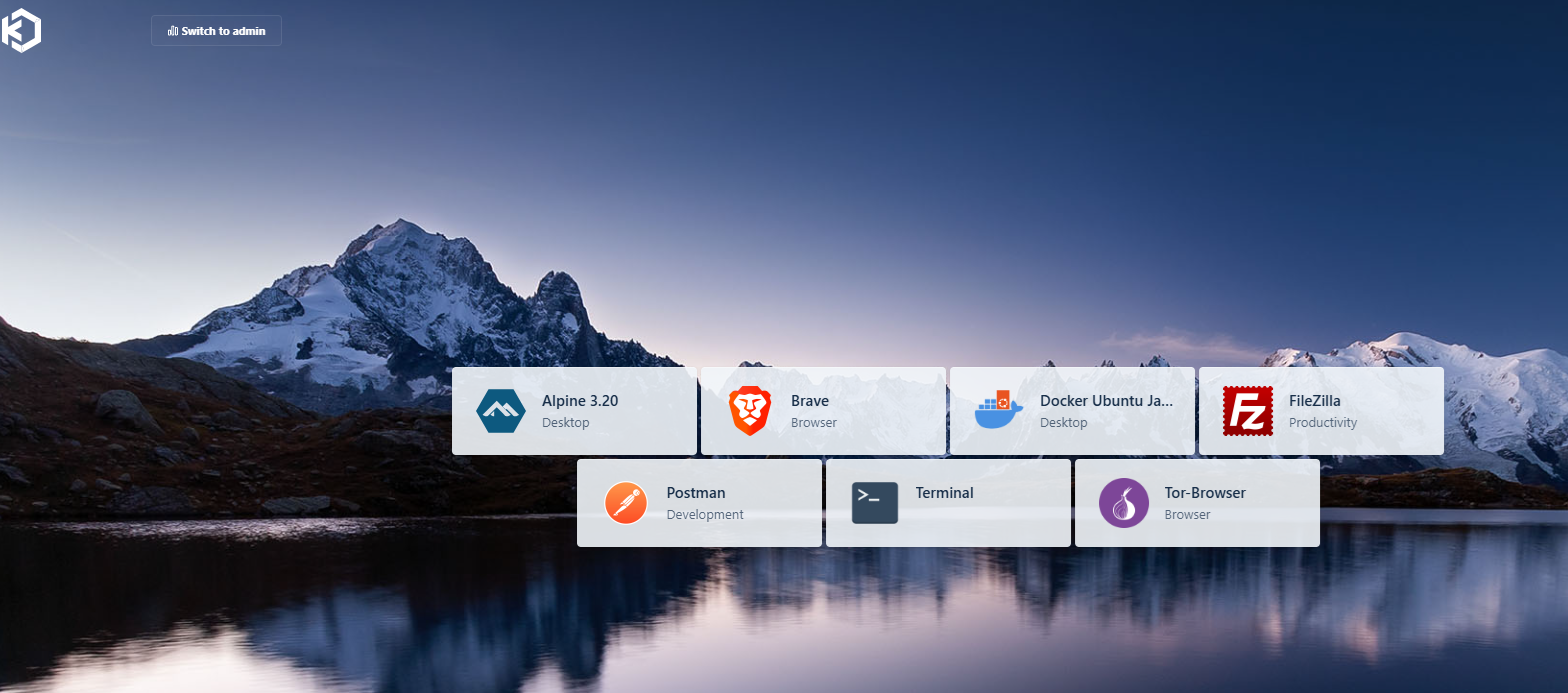
These days my homelab is a bit of a mess. Some dev environments for side projects, Kubernetes clusters, GitOps, Local LLM, workflows, CI/CD pipelines, monitoring tools, a bunch of self-hosted web apps and database for a local volunteer group I help with. Honestly, half the fun is seeing what new thing I can get running on it next. Below is a Heimdall dashboard it's an open source dashboard that manages all my applications. It has a nice organized interface for launching my applications that I can customize directly from the app. I use it to record all services running on my home lab, their URLs, and login credentials. There are some apps I use with the same IP pod different ports, so remembering all of them would be a pain..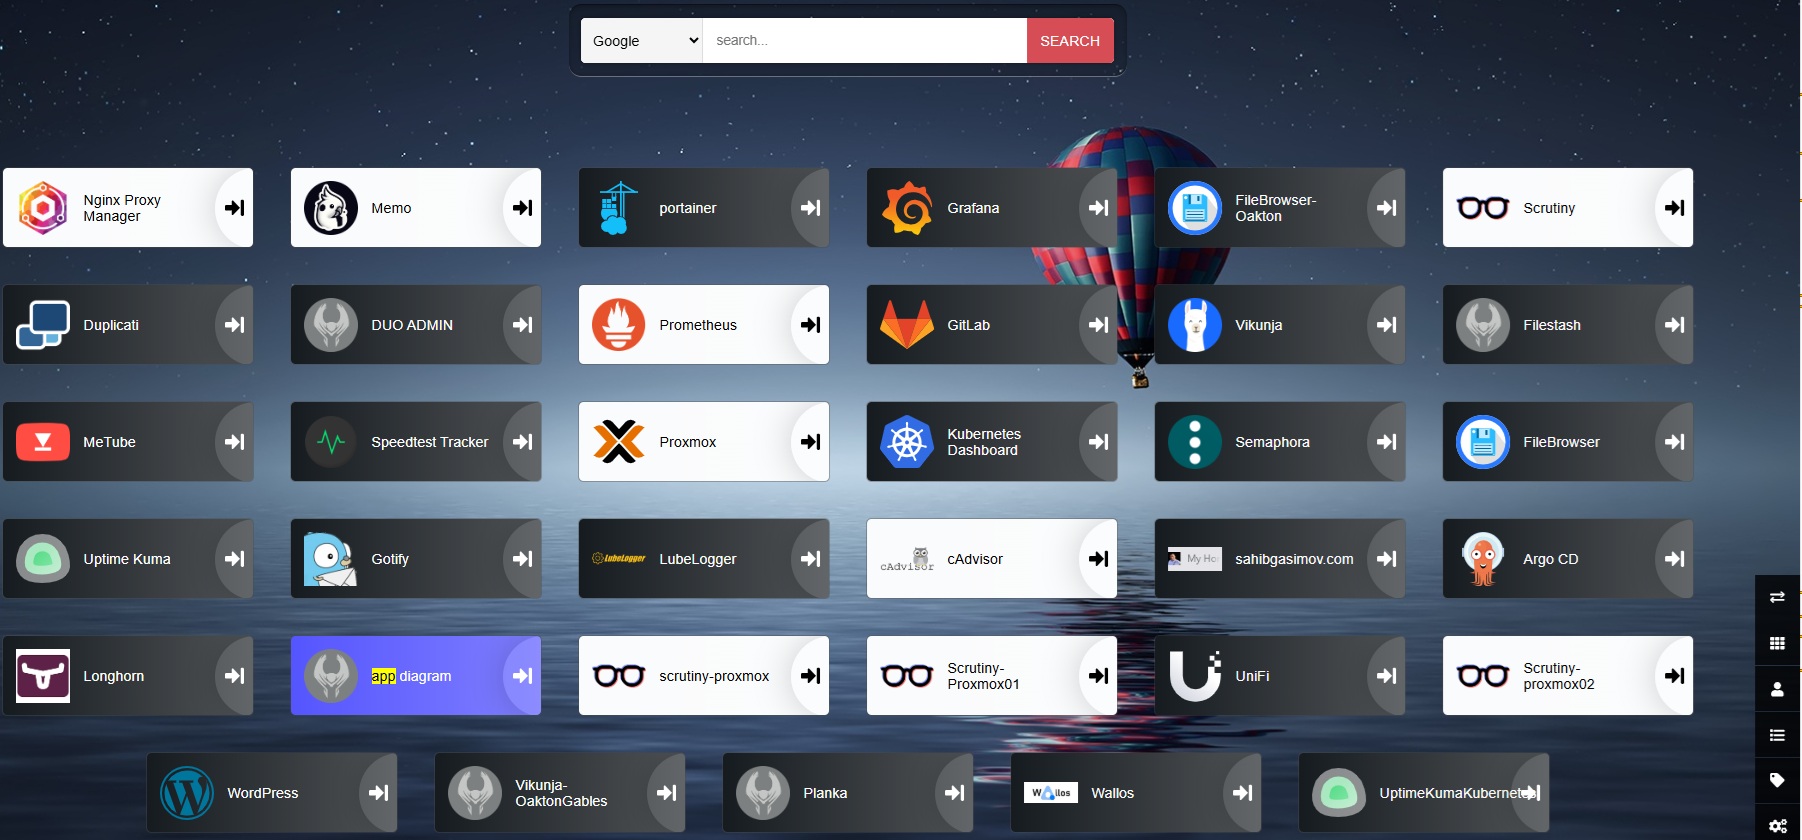
Most of my homelab apps are deployed either via Proxmox VM, LXC or run on my Kubernetes cluster. The number of applications changes over time, but there are several core services I consistently maintain.
I previously used Docker Compose containers for everything, I still use it for some workloads, but I have now migrated most of my apps inside Kubernetes. It's still ongoing, not everything fits perfectly into Kubernetes, but moving more workloads this helps me build skills that I not always touch at work but can bring to work, or translate directly to modern cloud-native environments .
LXC Containers vs Kubernetes
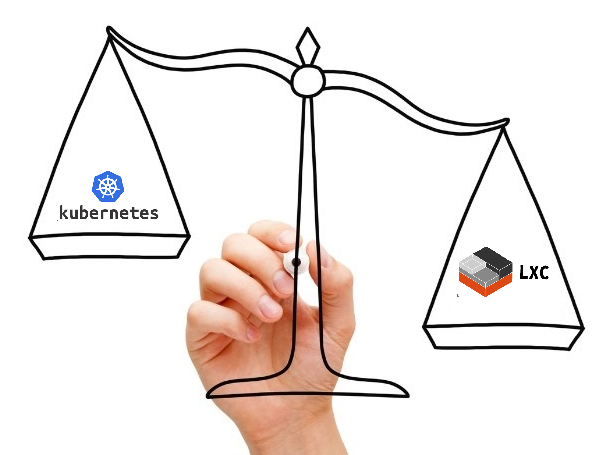
Not everything needs to run on Kubernetes.. I split my workloads between LXC containers on Proxmox and a Kubernetes cluster depending on what makes sense for each service as well as my own learning goals.
LXC containers on Proxmox are lightweight, fast to spin up, and share the host kernel. They work well for stateful services that need direct hardware access (like GPU passthrough for Ollama), apps that don't need horizontal scaling, or services where I want full OS-level control without the overhead of a full VM. Backups and snapshots are handled natively by Proxmox, and restoring a broken LXC takes seconds.
The other advantage of LXC is Proxmox Community Helper Scripts. These are pre-built LXC stacks that can be run as a script with ready application.
Services running on LXC: Paperless-NGX, Ollama LLM, Wazuh, GitLab, Vaultwarden, Tailscale, Beszel, Docker Compose workloads, WalOS, Linkwarden, Memos, Stirling-PDF, Kasm, and several others.
Kubernetes gives me declarative deployments, Helm-based package management, rolling updates, and a GitOps workflow through ArgoCD. For services where I want reproducible deploys, easy upgrades, and centralized monitoring, Kubernetes is the better fit. It is also the platform I work with professionally, so running it in my homelab keeps my skills sharp.
Current Helm releases on my cluster:
- ArgoCD - GitOps continuous delivery
- GitLab Runner - CI/CD pipeline execution
- Helm Dashboard - web UI for Helm releases
- kube-prometheus-stack - Prometheus, Grafana, Alertmanager
- MetalLB - bare-metal load balancer
- ntfy - push notifications for cron jobs
- Reloader - auto-restart pods on config changes
- SearXNG - self-hosted metasearch engine
- Semaphore - Ansible automation UI
- Uptime Kuma - service monitoring
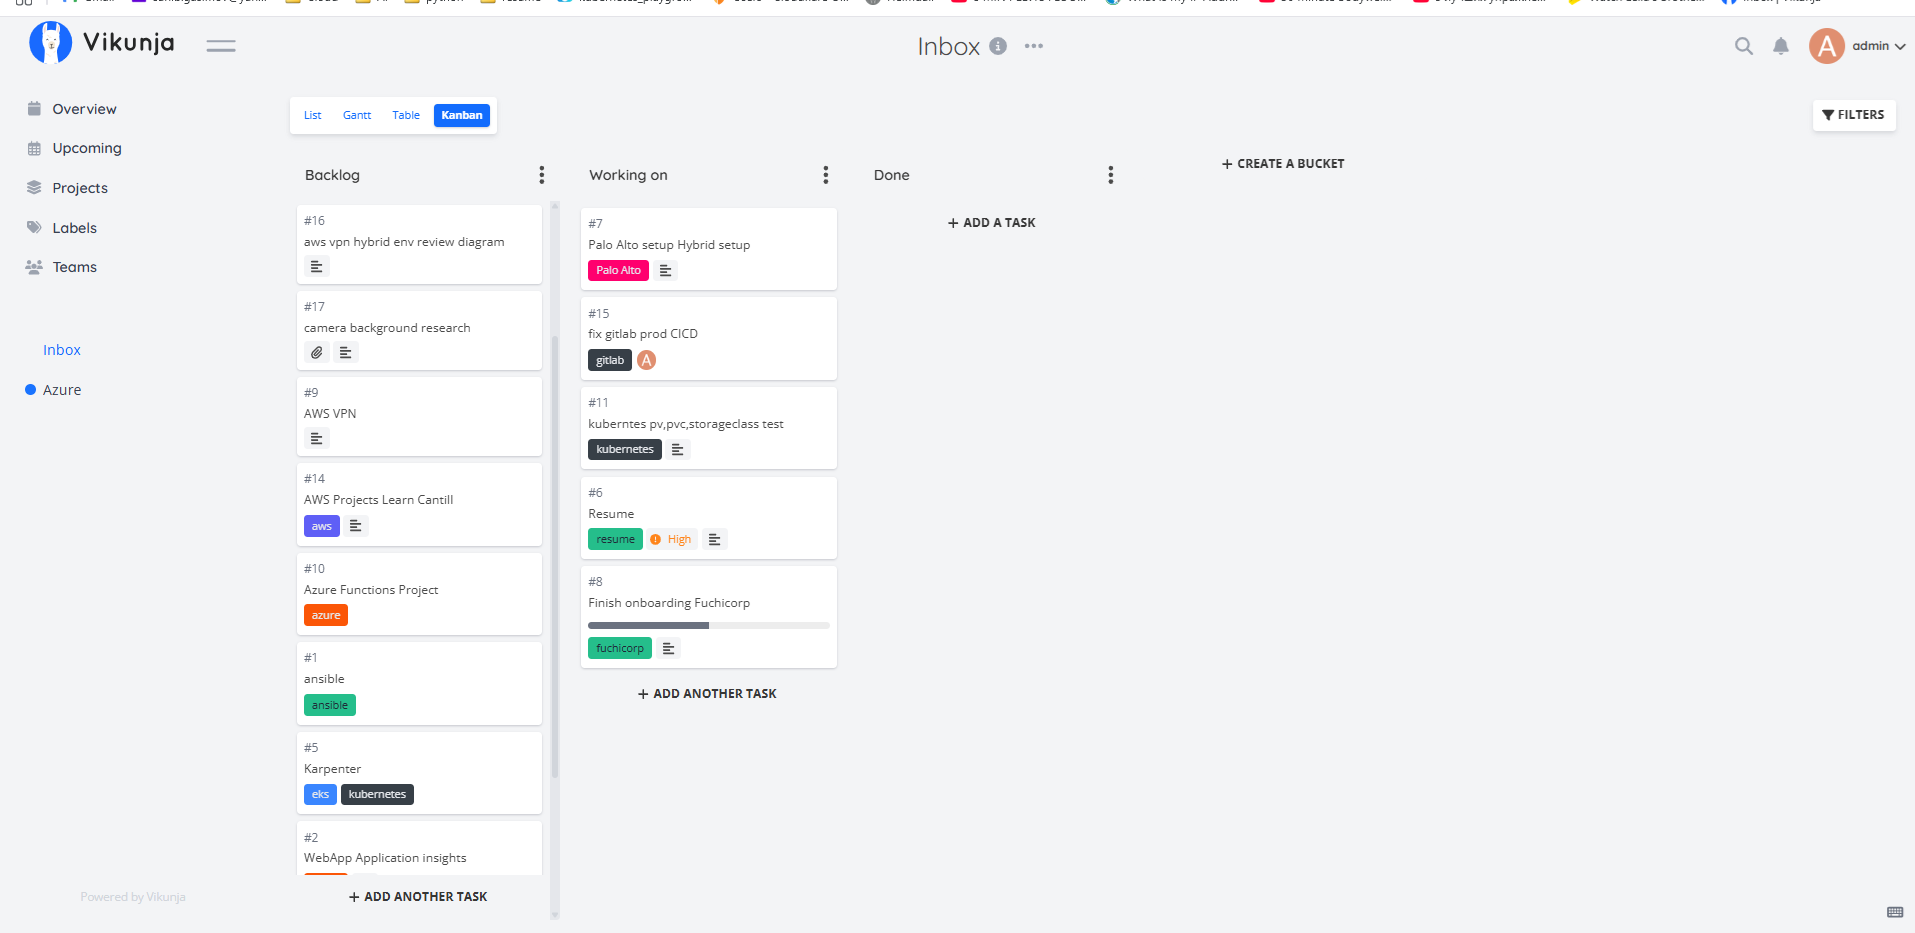
- Vikunja - task management / Kanban board
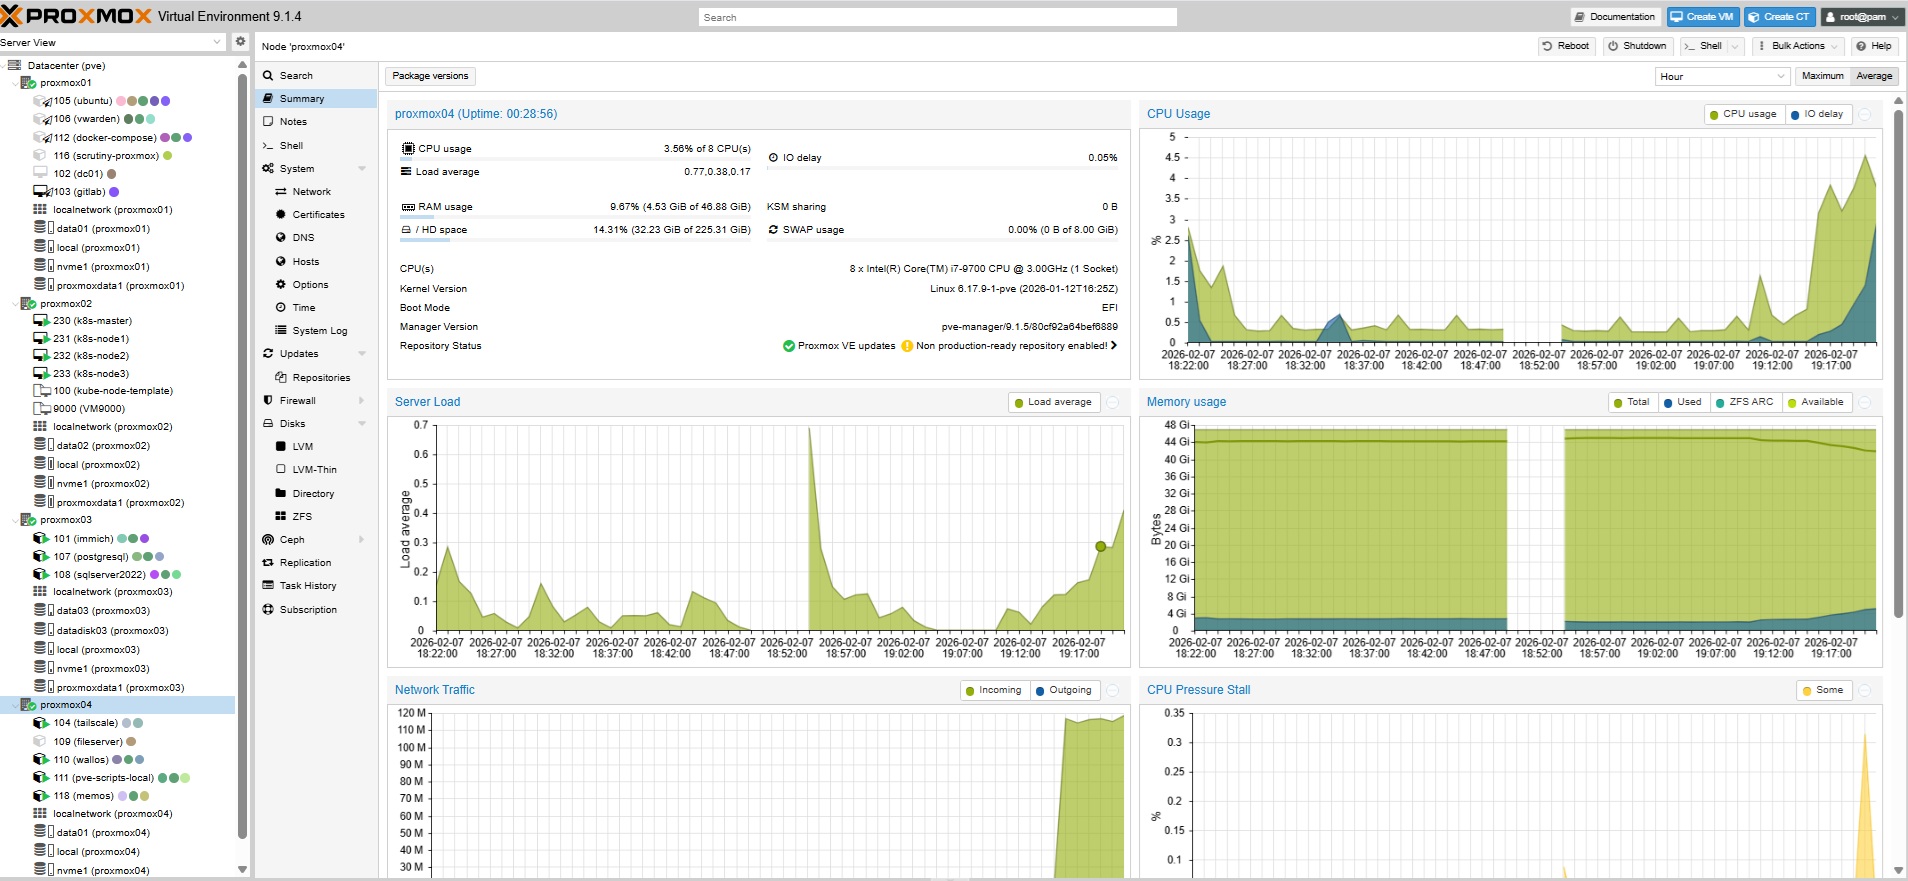
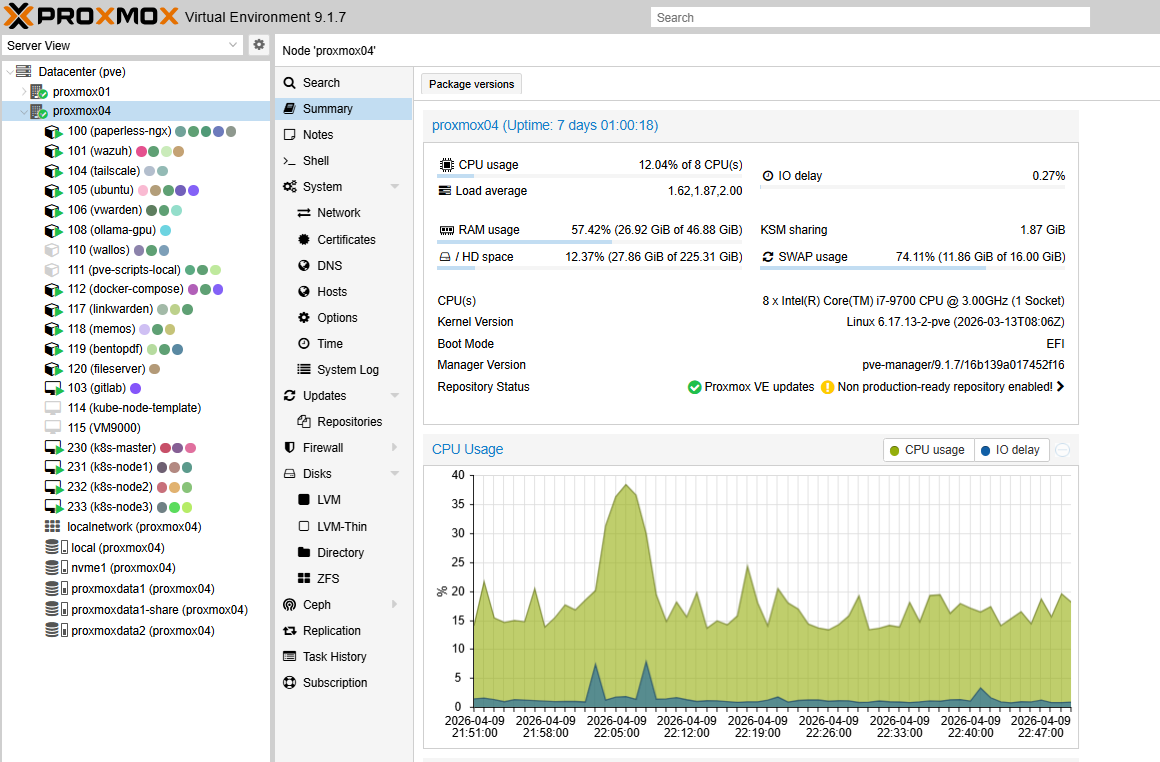
Homelab's Core
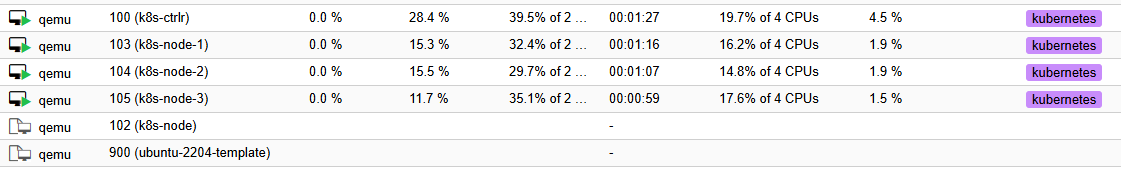
Proxmox Cluster - One of the reason I started exploring Proxmox virtualization initially was to set up a home Kubernetes cluster.
Proxmox Backup Server - nothing specific to say about it, just a great tool for backing up and restoring VMs. I've already needed it a few times after messing up configs. Totally a lifesaver..
TrueNAS - Currently running on a RackChoice 2U server case with 8 x 3.5" hot-swap bays and 6 Gbps throughput, housing eight 4TB disks in a RAIDZ2 pool. The initial idea was having a basic network file share for personal , family storage, volunteer community projects and backups. I started with Samba on Ubuntu Server, but eventually moved to TrueNAS for proper storage pool management, ZFS snapshots, and SMB/NFS shares all in one place.
GitLab - I used to run Gitlab server on docker-compose. The pros was definetely the speed and job processing time, however one day all of sudden it just crashed and it took me a lot of efforts to retrieve the data back. SIince then I've moved Gitlab to a Proxmox VM, I have backups, snapshots on smb share drive, which makes my life much easier. I also run a GitLab Runner on Kubernetes via Helm, which handles my CI/CD pipelines for deploying apps to the cluster.
Moving to GitOps with Argo CD
For a long time, every app on my cluster had its own little deploy.sh or helm.sh
script sitting in a folder. To deploy or update something, I'd SSH in, navigate to the right folder, and run
the script manually. It worked, but it got messy fast. Scripts got out of date, I'd forget which version was
actually running on the cluster, and if I rebuilt a node or wanted to recreate an app, I had to go digging
through folders to find the right commands. There was no single place that told me "this is what the cluster
should look like."
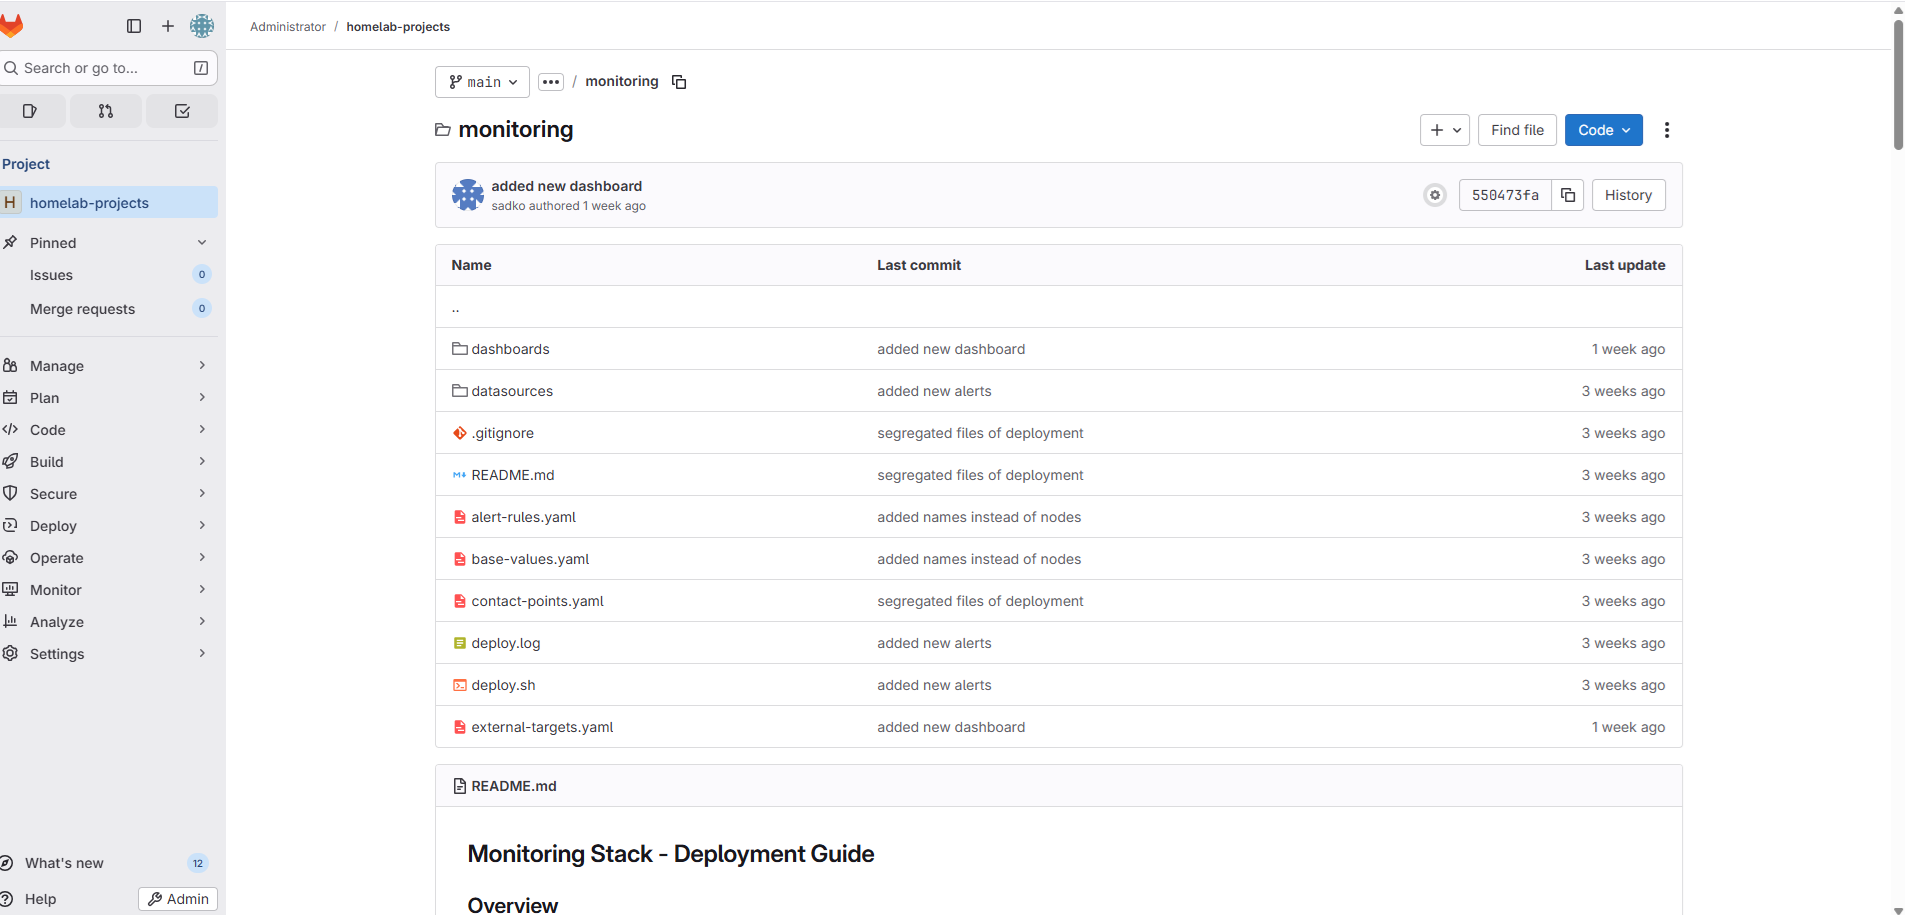
I eventually moved everything to Argo CD. The idea is simple: you keep all your app configs in a Git repo, and Argo CD watches that repo and makes sure the cluster matches what's in it. Push a change to Git, Argo CD picks it up and syncs. That's it. No more SSHing in to run scripts.
The repo is structured like this:
apps/- one YAML file per app, telling Argo CD where the chart is and which namespace to deploy it tocharts/- Helm charts for each app, with avalues.yamlholding all the configbootstrap/root-app.yaml- applied once manually; after that Argo CD manages itself and picks up any new files added toapps/automatically
All upstream charts are vendored (the .tgz tarball is committed into the repo), so Argo CD
never needs to reach out to external Helm repos at sync time. Works fully offline.
Now all 13+ apps on the cluster are managed this way - Argo CD, MetalLB, Prometheus stack, Semaphore,
Vikunja, ntfy, and the rest. If I want to change a config, I edit the values.yaml, commit, push,
and Argo CD handles the rest. If someone (me, at 2am) manually runs kubectl apply or
helm upgrade on a managed app, Argo CD will revert it back to what's in Git within a few minutes.
That self-healing behaviour has already saved me from myself a couple of times.
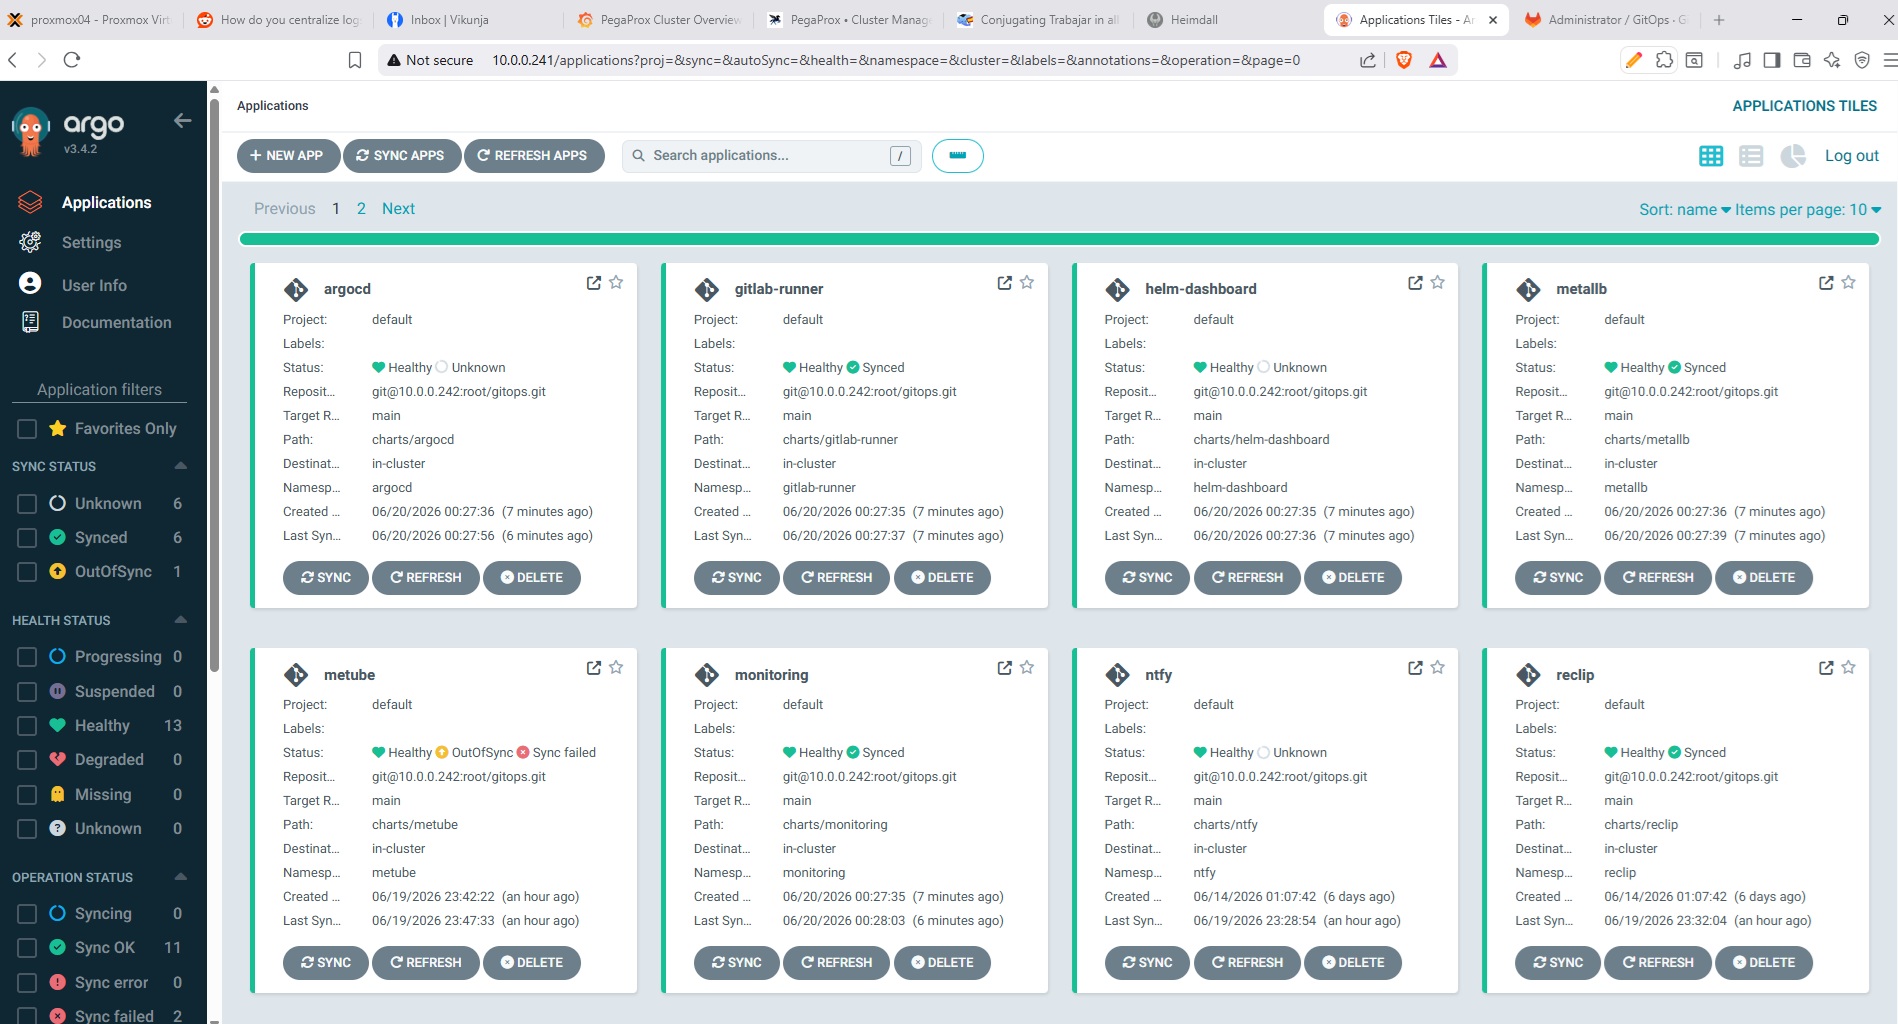
Argo CD dashboard - all apps synced from the GitLab repo
Ollama - My Local LLM server running on my Dell Precision 3630 with GPU passthrough to an LXC container. I use it for document processing via Paperless-NGX, as a coding assistant as well as in VS Code through the Continue.dev extension, and as a general chat interface through Open WebUI. Everything runs on the RTX 3060 with no cloud API calls. For the full setup details, see my Local AI with Ollama on Proxmox article.
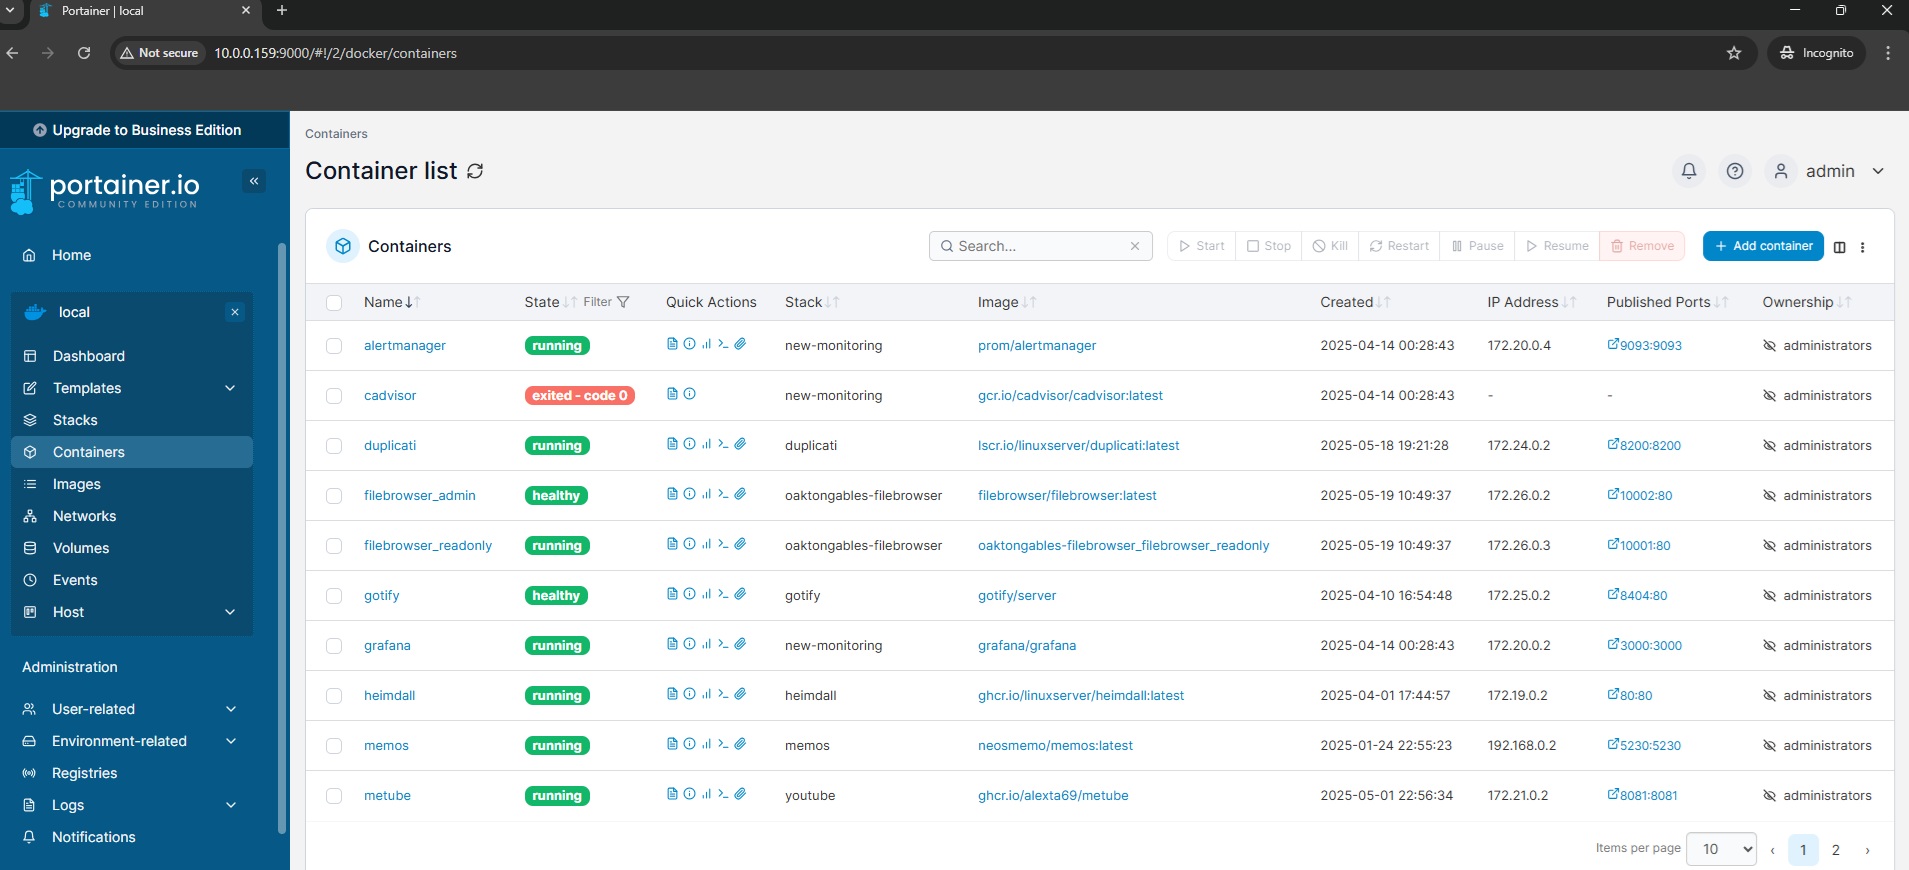
Portainer - I use it for managing my Docker containers, even thoguh I currently don't have many.. But in general it may come super helpful if I need to clean up old images or troubleshoot a container.
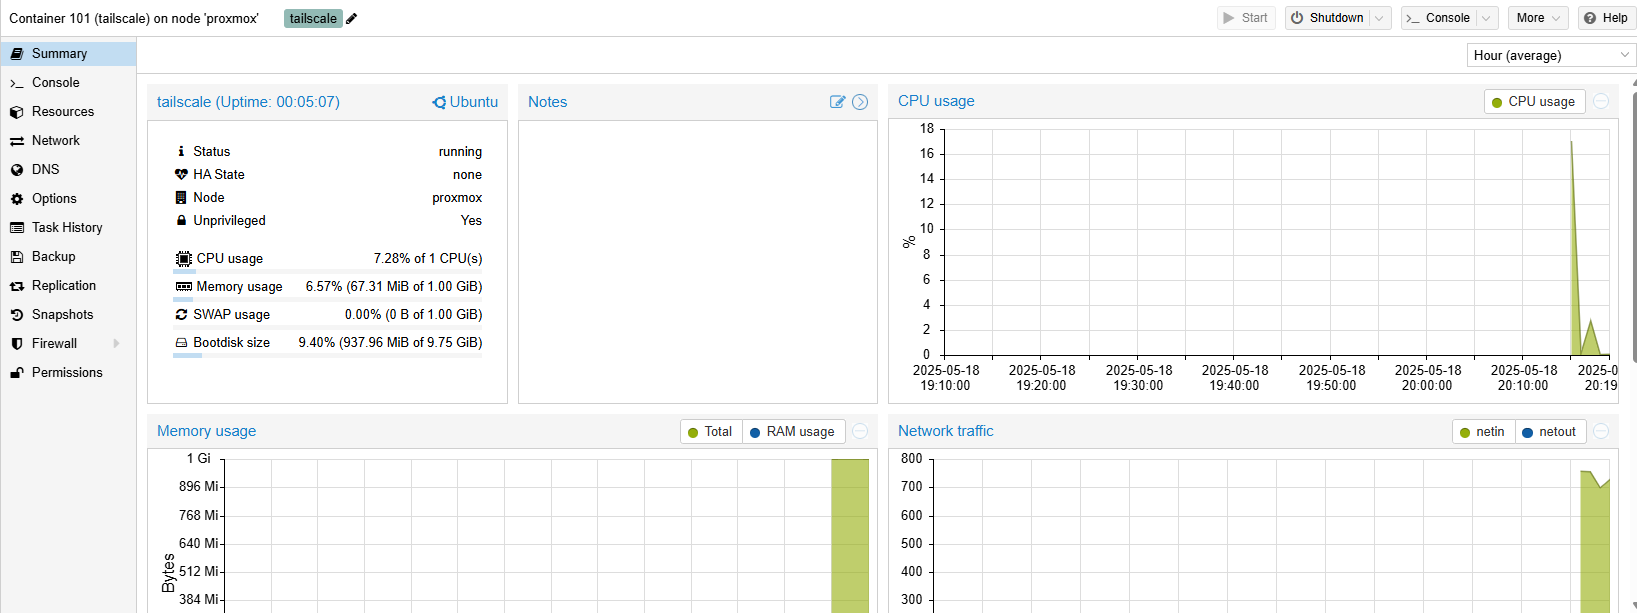
Tailscale - I use Tailscale VPN with one of the VM on my Proxmox cluster configured as an exit node. This allows me to access my local network from anywhere securely, without needing each individual device to be connected to the VPN, super useful when I'm traveling or working remotely.
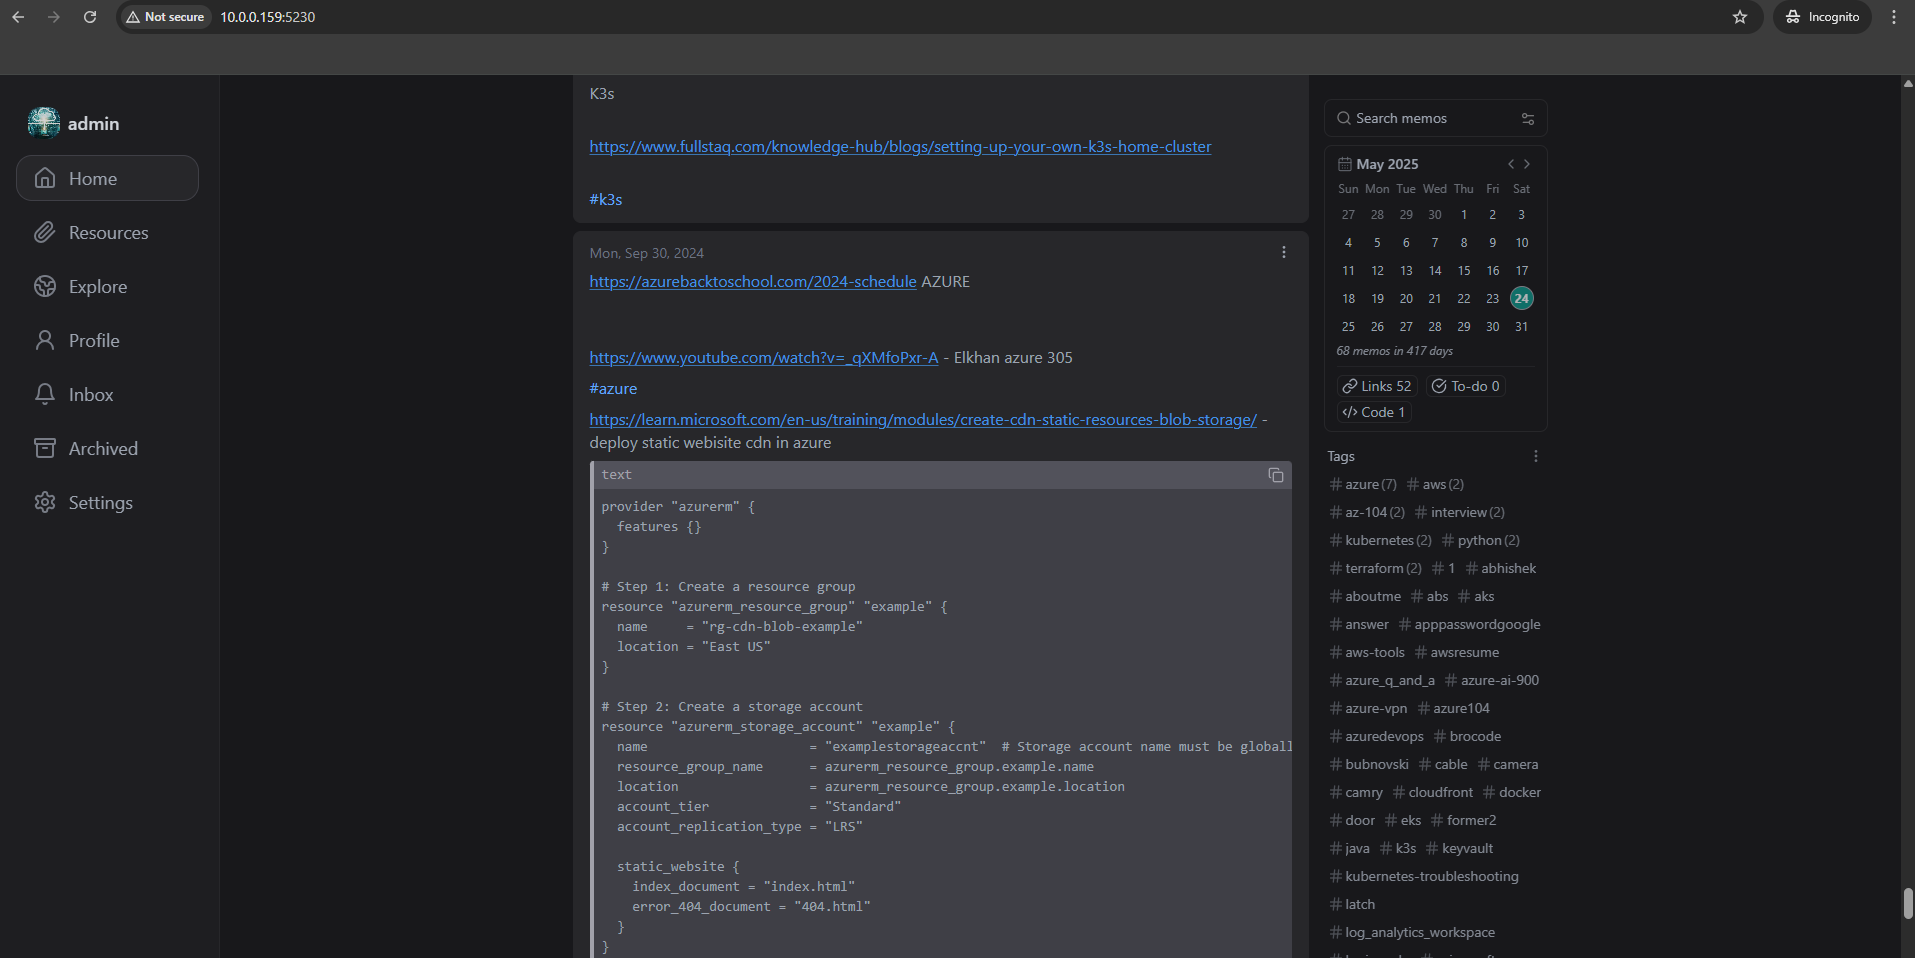
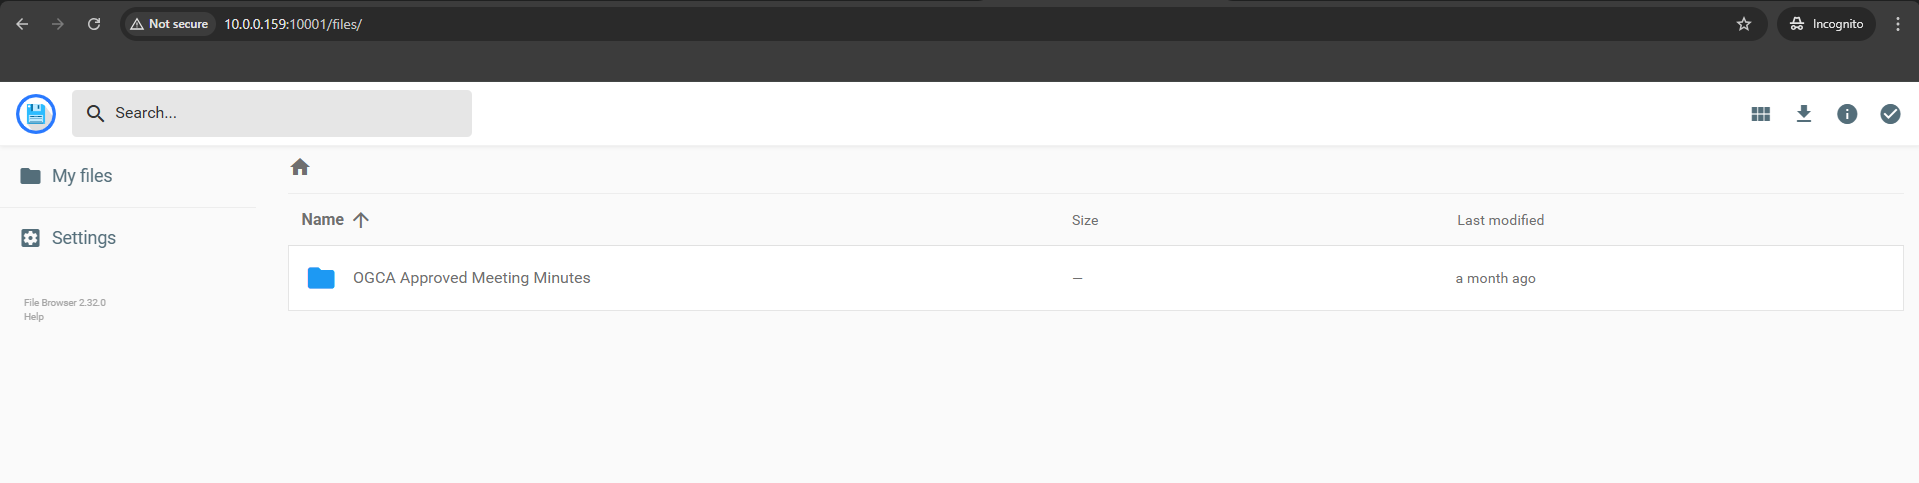
Memos, Vikunja (I use this for my Kanban To Do tasks) and Filebrowser these three apps are my go-to tools for staying organized, Memos for quick notes, Vikunja for task tracking, and Filebrowser for quick file sharing.
ntfy - A simple self-hosted push notification server.
I deploy it on Kubernetes via Helm and use it to get phone notifications when my cron backup jobs finish or fail
-
just a one-liner curl call at the end of each cron entry. I have the ntfy Android app on my phone,
and when I'm away from home I connect via Tailscale to reach my local ntfy instance. Simple and does exactly
what I need.
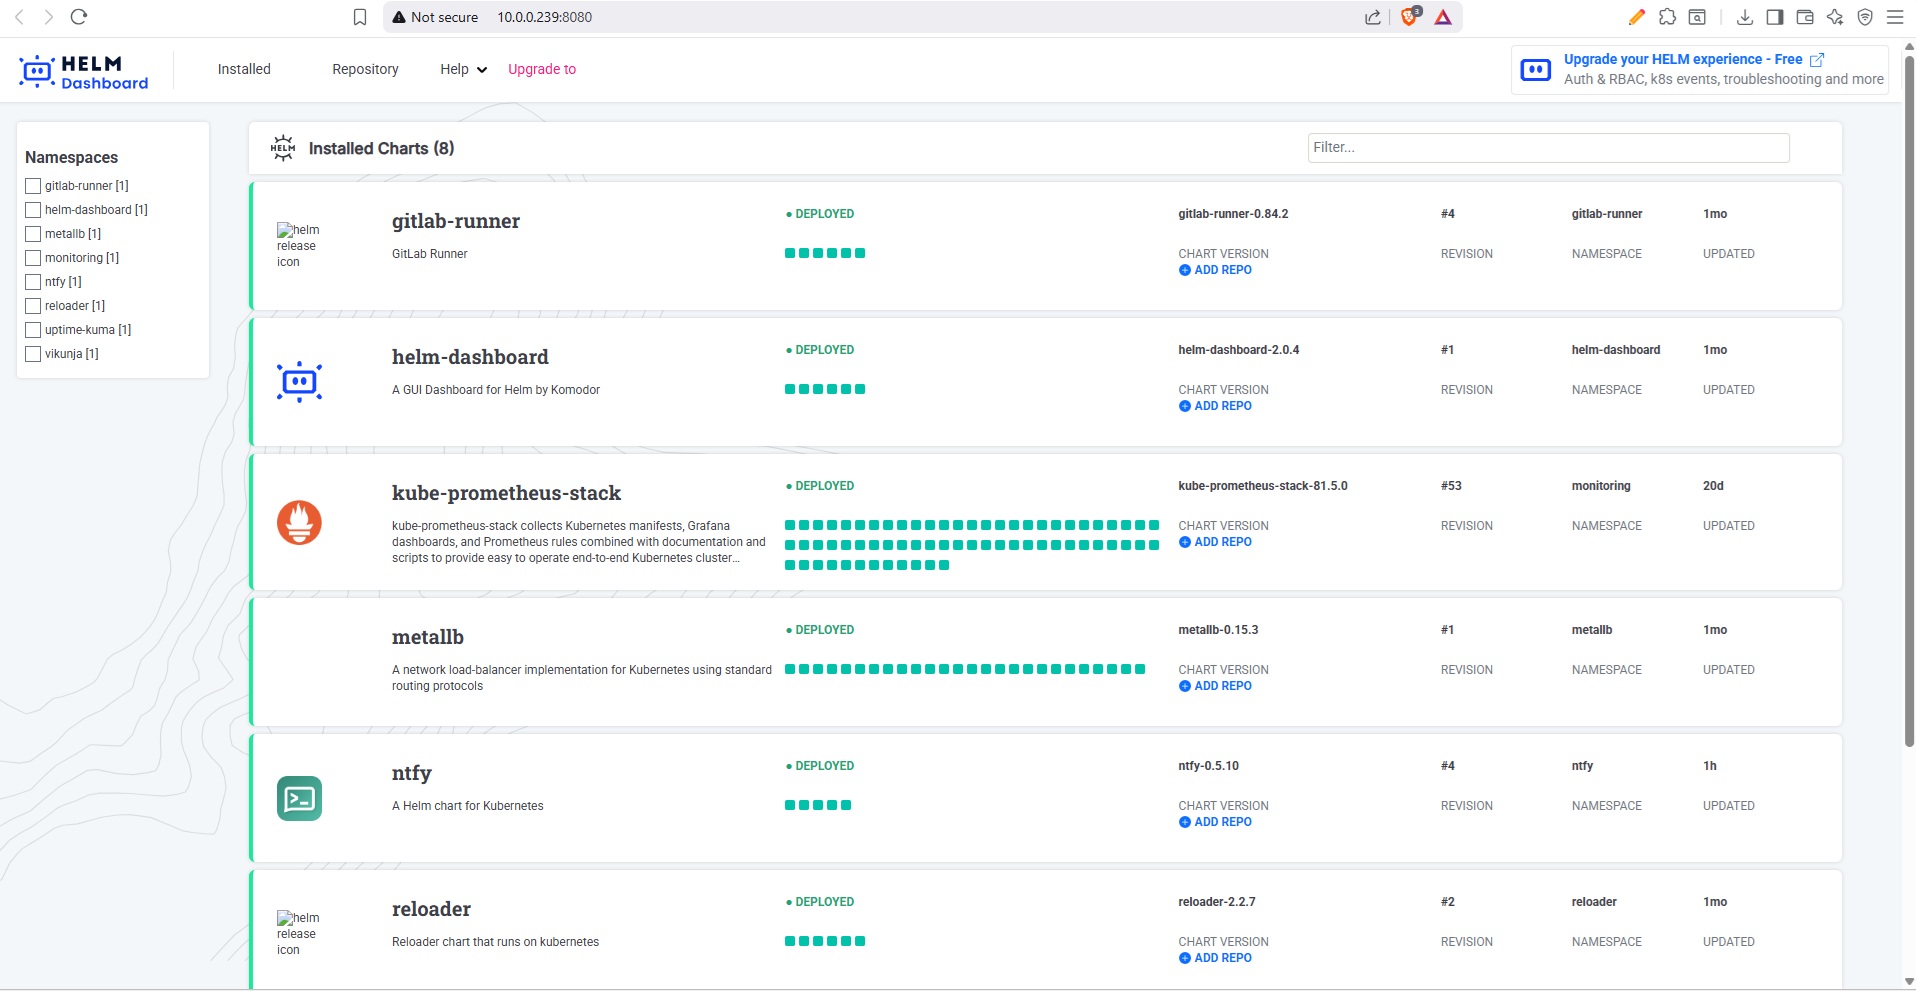
Helm Dashboard - A simple web
UI for managing my Helm releases on Kubernetes. Instead of running helm list and digging through
CLI output, I can see all releases, their status, values, and upgrade history in a browser. Handy for a quick
overview of what's deployed across namespaces.
Kasm Workspaces - I's like being able to set up browser-accessible desktops whenever you need them. I use the free version for safely hopping onto websites, apps, or even full desktop environments, all wrapped up in isolated containers. When I'm done browsing or testing something new, I can start fresh without any leftovers. Plus, if I want to stay extra private, I just run Firefox or Opera with a VPN and then close the session. It's a nice way to keep things under wraps.
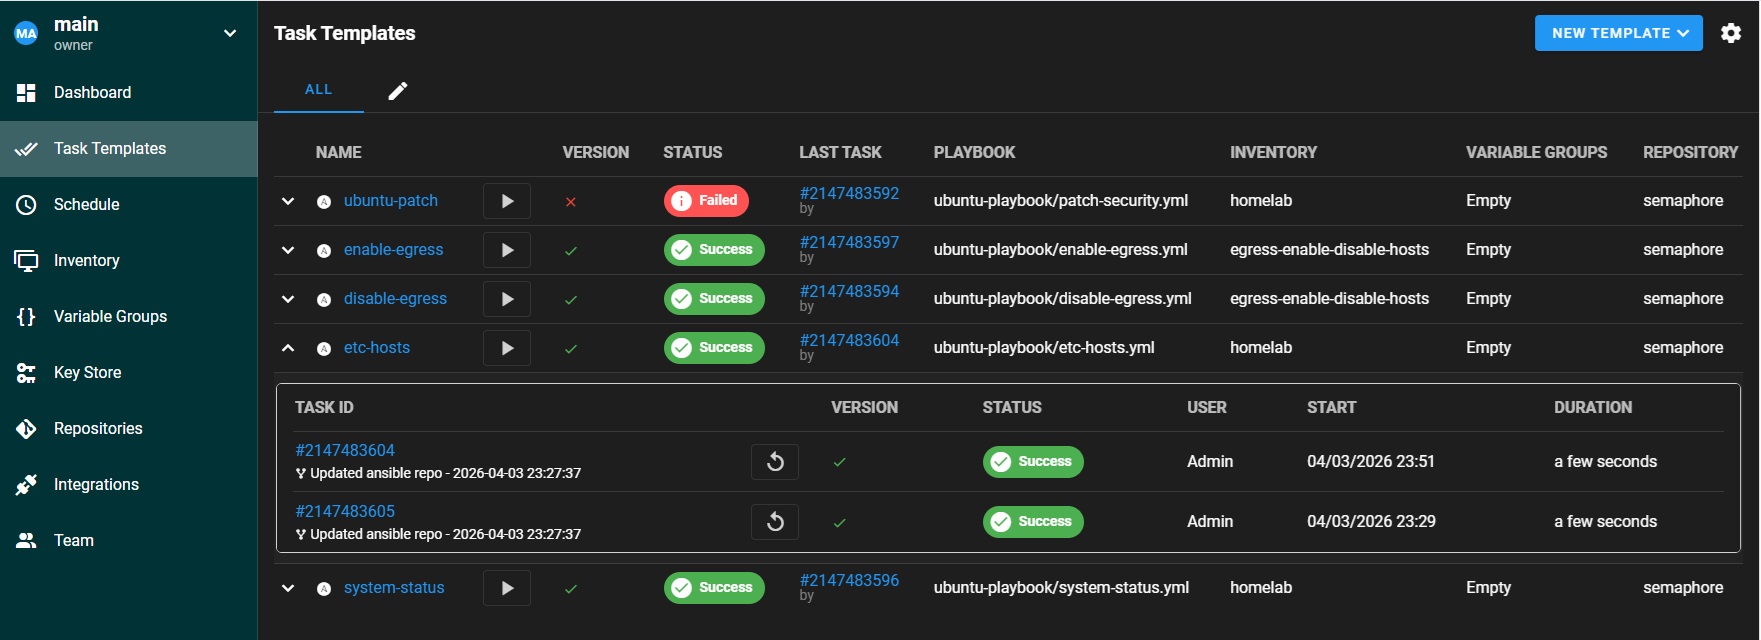
Semaphore - A web UI for running Ansible playbooks. I deploy it on Kubernetes via Helm and use it to schedule patching, config management, and maintenance tasks across all my VMs and LXC containers. It replaced AWX for most of my automation needs because it is much lighter and faster to deploy.
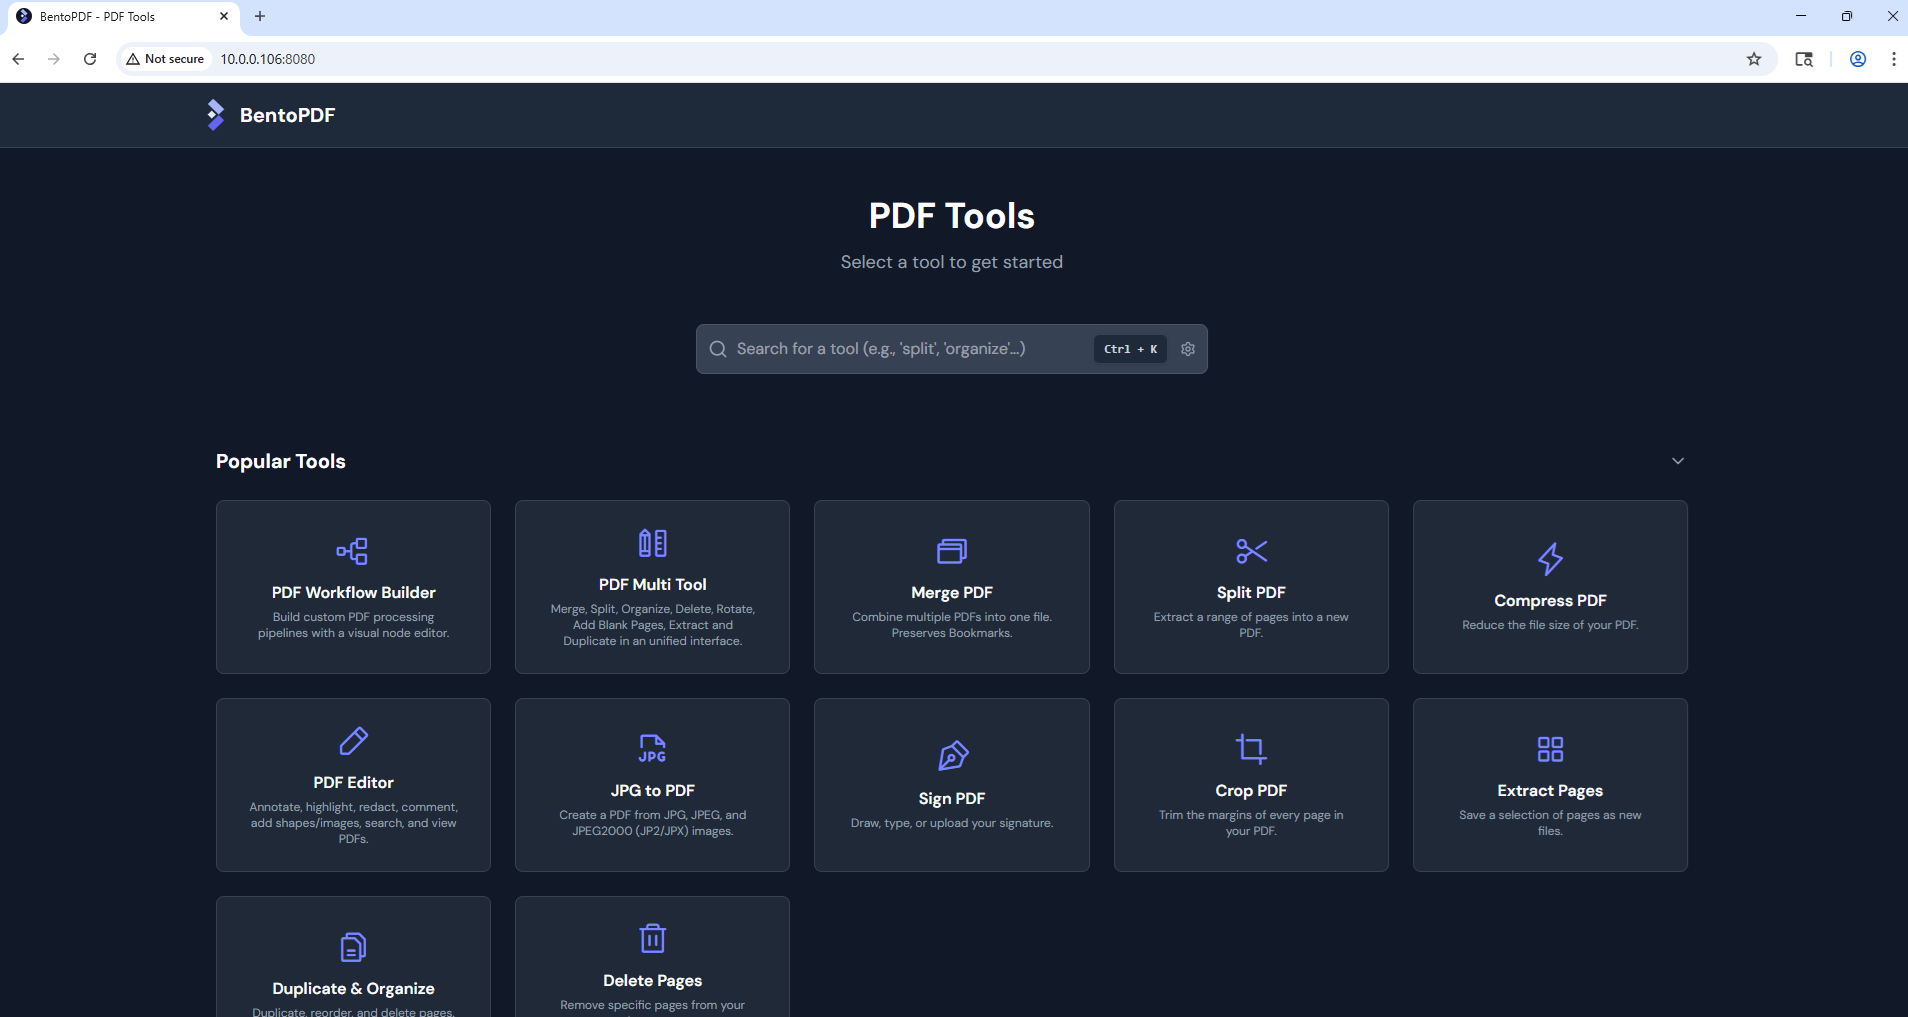
BentoPDF - A self-hosted PDF tool for merging, splitting, compressing, and converting documents. I run it as an LXC container on Proxmox. For privacy, I don't use free online PDF tools that upload files to unknown servers, and I don't want to pay for Adobe. BentoPDF keeps everything local.
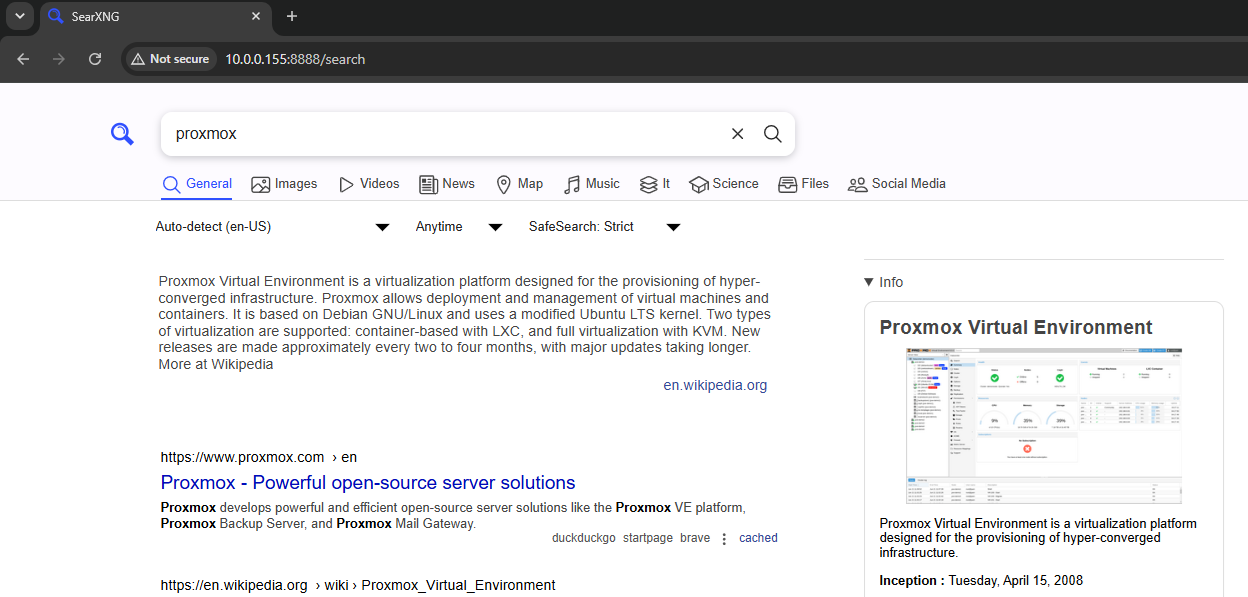
SearXNG - A self-hosted metasearch engine that queries multiple search engines at once and returns combined results, without tracking you or building a profile. I type a query, it hits Google, Bing, DuckDuckGo, and a bunch of others in parallel and shows you everything in one clean page. No accounts, no history, no filter bubble. I also use it as the search backend for Open WebUI so the local LLM can do web lookups without going through a third-party API.
Security and Networking Setup
Networking and security in a homelab is always a bit of a rabbit hole. I started simple just exposing a couple of services on ports, but after a few too many random bots hitting my open ports, I decided to tighten things up...
I use Cloudflare as my reverse proxy for anything web-based. It handles my three domains, manages SSL certificates, and listens on local Docker ports. I also run Cloudflare Tunnels to access certain services without needing to open any ports which makes life a lot simpler.
For internal apps, I started experimenting with Cloudflare Zero Trust to lock things down even further with it's policies.
My bastion server has DUO MFA for SSH access. I do use Tailscale exit node to access my local network when I need to connect remotely.
For secrets and passwords, I run Vaultwarden (a lightweight Bitwarden-compatible server) on Kubernetes via Helm. Syncs with my browsers and phone.
Other things I've put in place:
- Fail2Ban to block brute-force attempts on exposed ports (this alone catches a lot)
- UFW firewall on all VMs and Docker hosts. On data-sensitive servers like my fileserver and Vaultwarden, I block all outbound (egress) traffic by default. This way, even if something gets compromised, it cannot phone home. I only temporarily enable egress during patching using an Ansible playbook triggered through Semaphore, and disable it again once updates are done.
- Wildcard SSL via Cloudflare DNS for external services
Grafana Loki I use to pull in logs from the bastion and key servers, all centralized in Grafana.
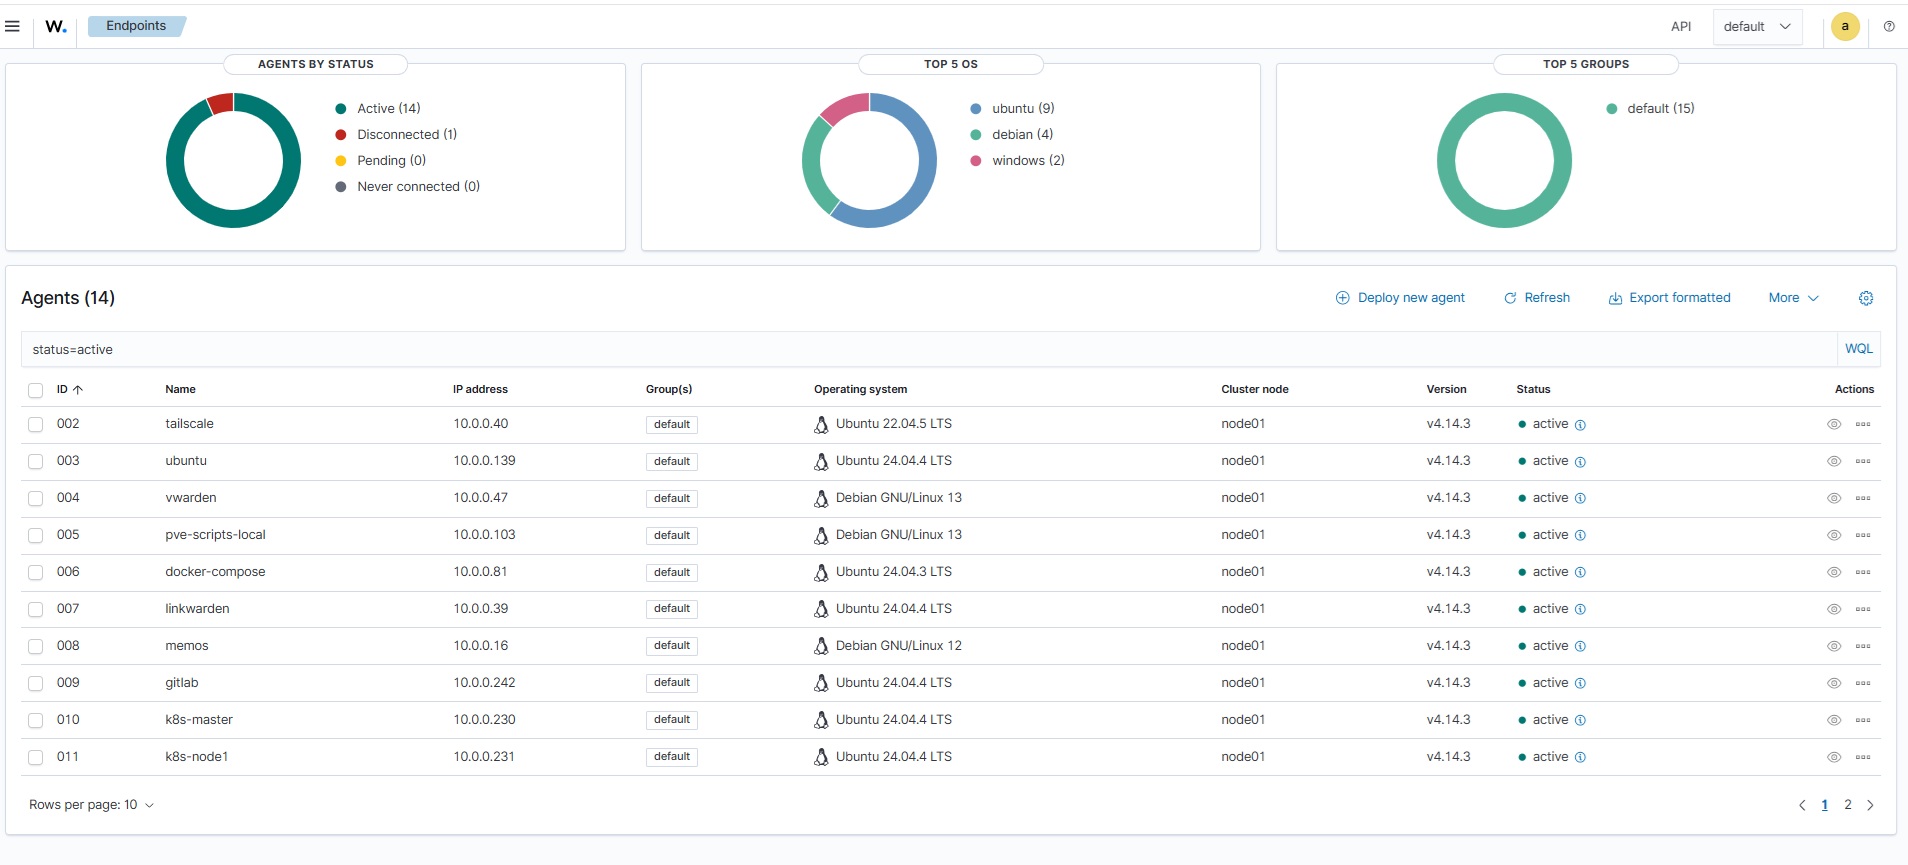
I also run Wazuh - an open source security platform for threat detection, integrity monitoring, and log analysis. It runs as a VM on Proxmox with agents on my servers and Kubernetes nodes. Gives me a centralized view of security events across the whole homelab - failed logins, file integrity changes, suspicious processes.
Load Balancing with
One challenge with running Kubernetes in a homelab is that there's no cloud provider to hand out external IPs for LoadBalancer services. MetalLB solved that problem for me, it's a bare-metal load balancer that gives services real IPs from a pool I define.
I deployed it via Helm and configured it in Layer 2 mode with an IP range from my home network. Now when I create a LoadBalancer service, MetalLB assigns it an IP automatically, all pods of that service are then accessible via that IP.
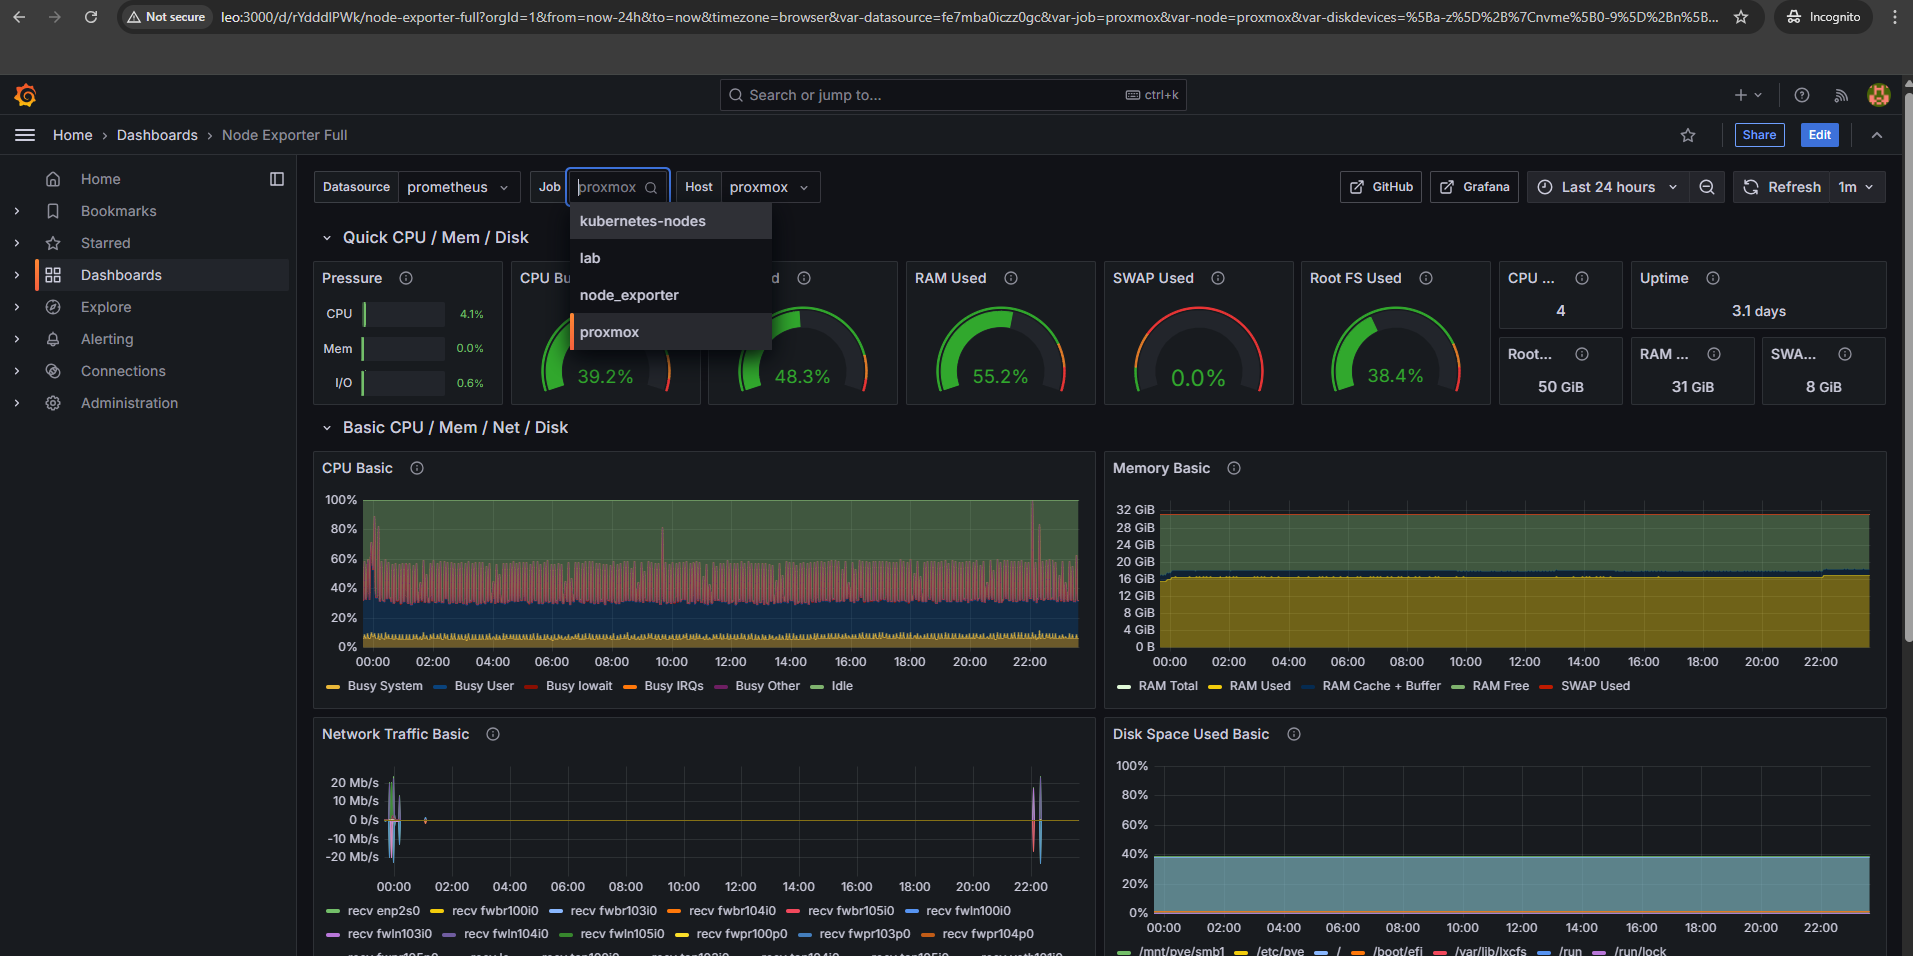
Monitoring Setup
My monitoring stack now runs mainly on Kubernetes using kube-prometheus-stack deployed via Helm (I also use Beszel and Uptime Kuma for additional monitoring). It includes Prometheus, Grafana, Alertmanager, and various exporters. I also run node-exporter on my physical hosts and Proxmox nodes to collect system metrics.
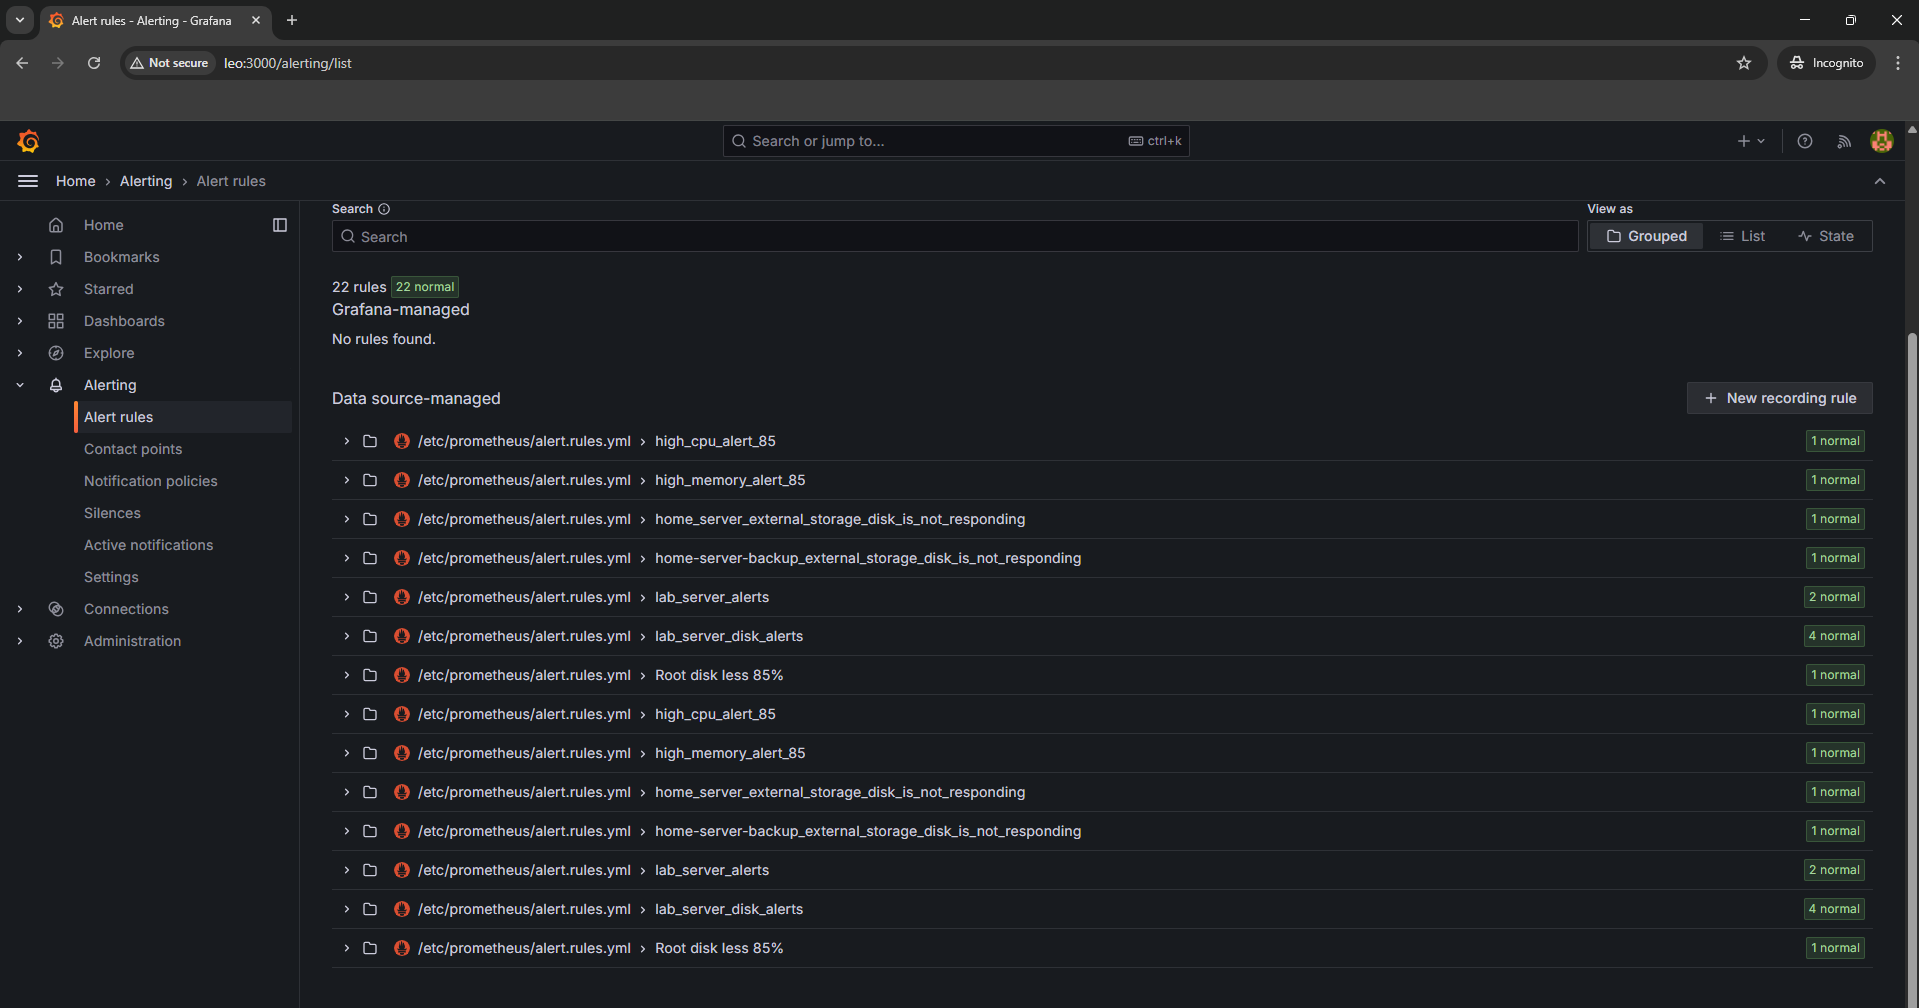
The setup alerts me via email when things go wrong, high CPU, memory issues, disk space running low, or services going down. Helm makes it easy to manage and update the whole stack with a single values file.
All my Grafana dashboards are managed through IaC, no manual clicking around. Dashboards are defined in code and deployed automatically, so everything stays consistent and reproducible. I use cAdvisor for containers.
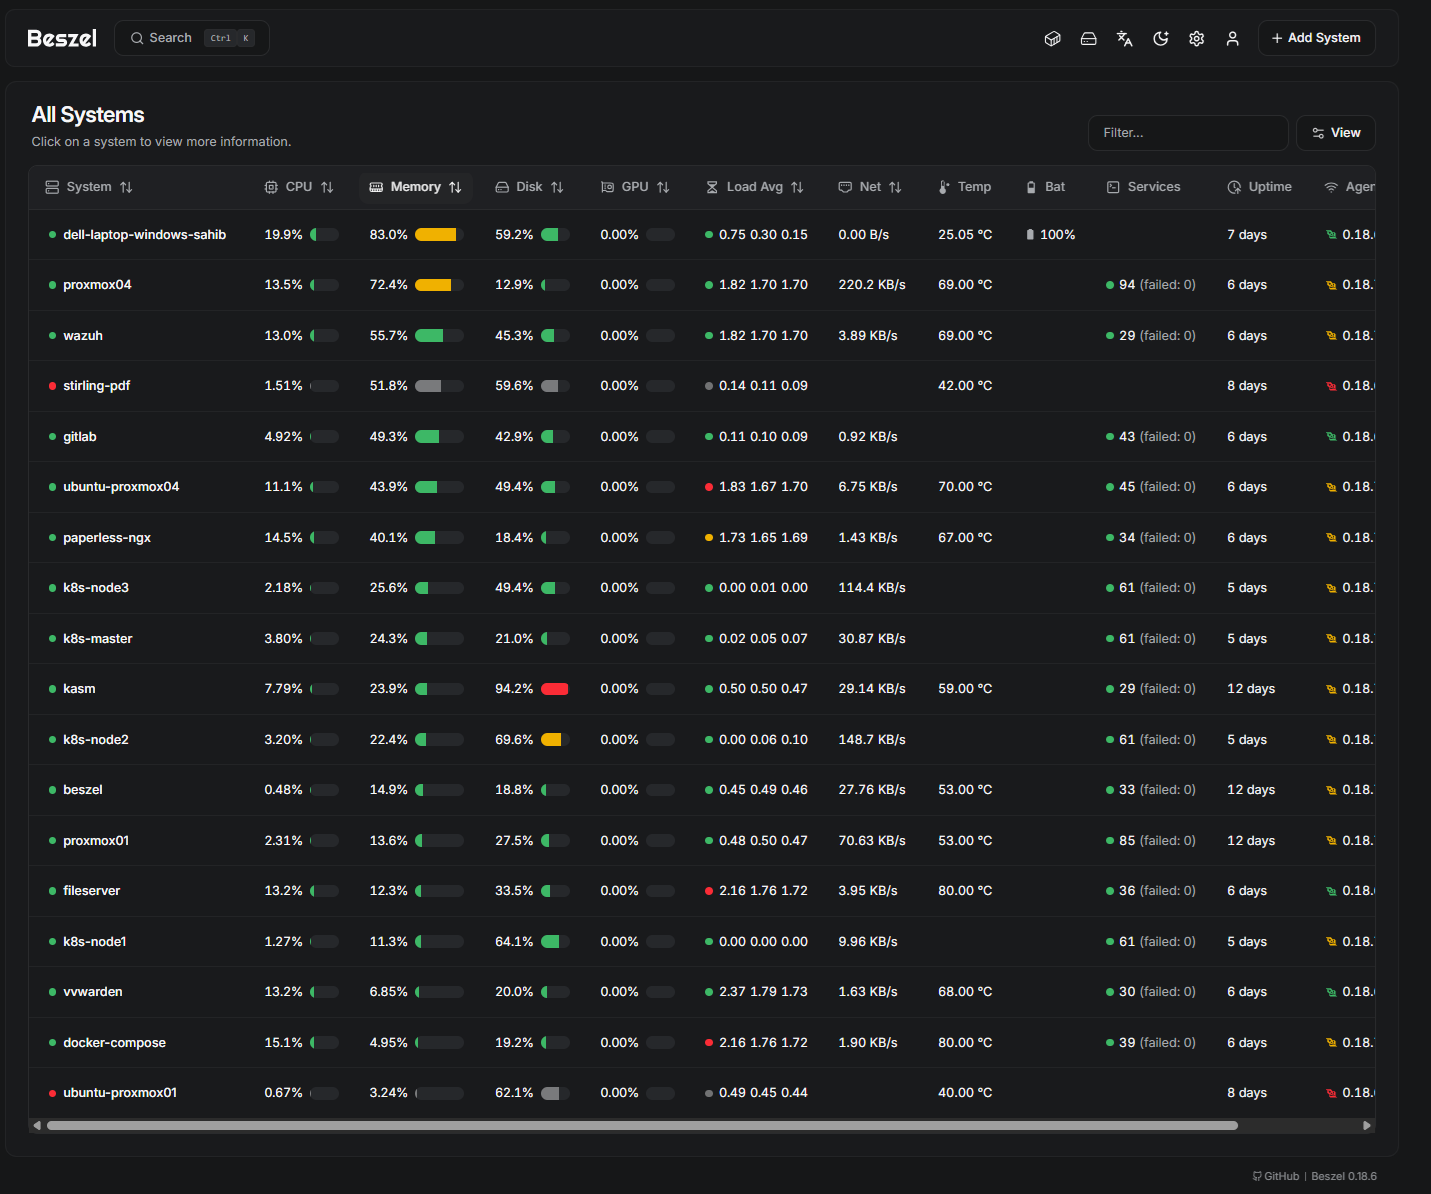
Beszel - A lightweight server monitoring tool that tracks CPU, memory, disk, and network usage across all my machines. It runs as an LXC container on Proxmox and collects metrics from agents deployed on each host. Simple to set up, low overhead, and gives me a quick overview of system health without the complexity of a full monitoring stack.
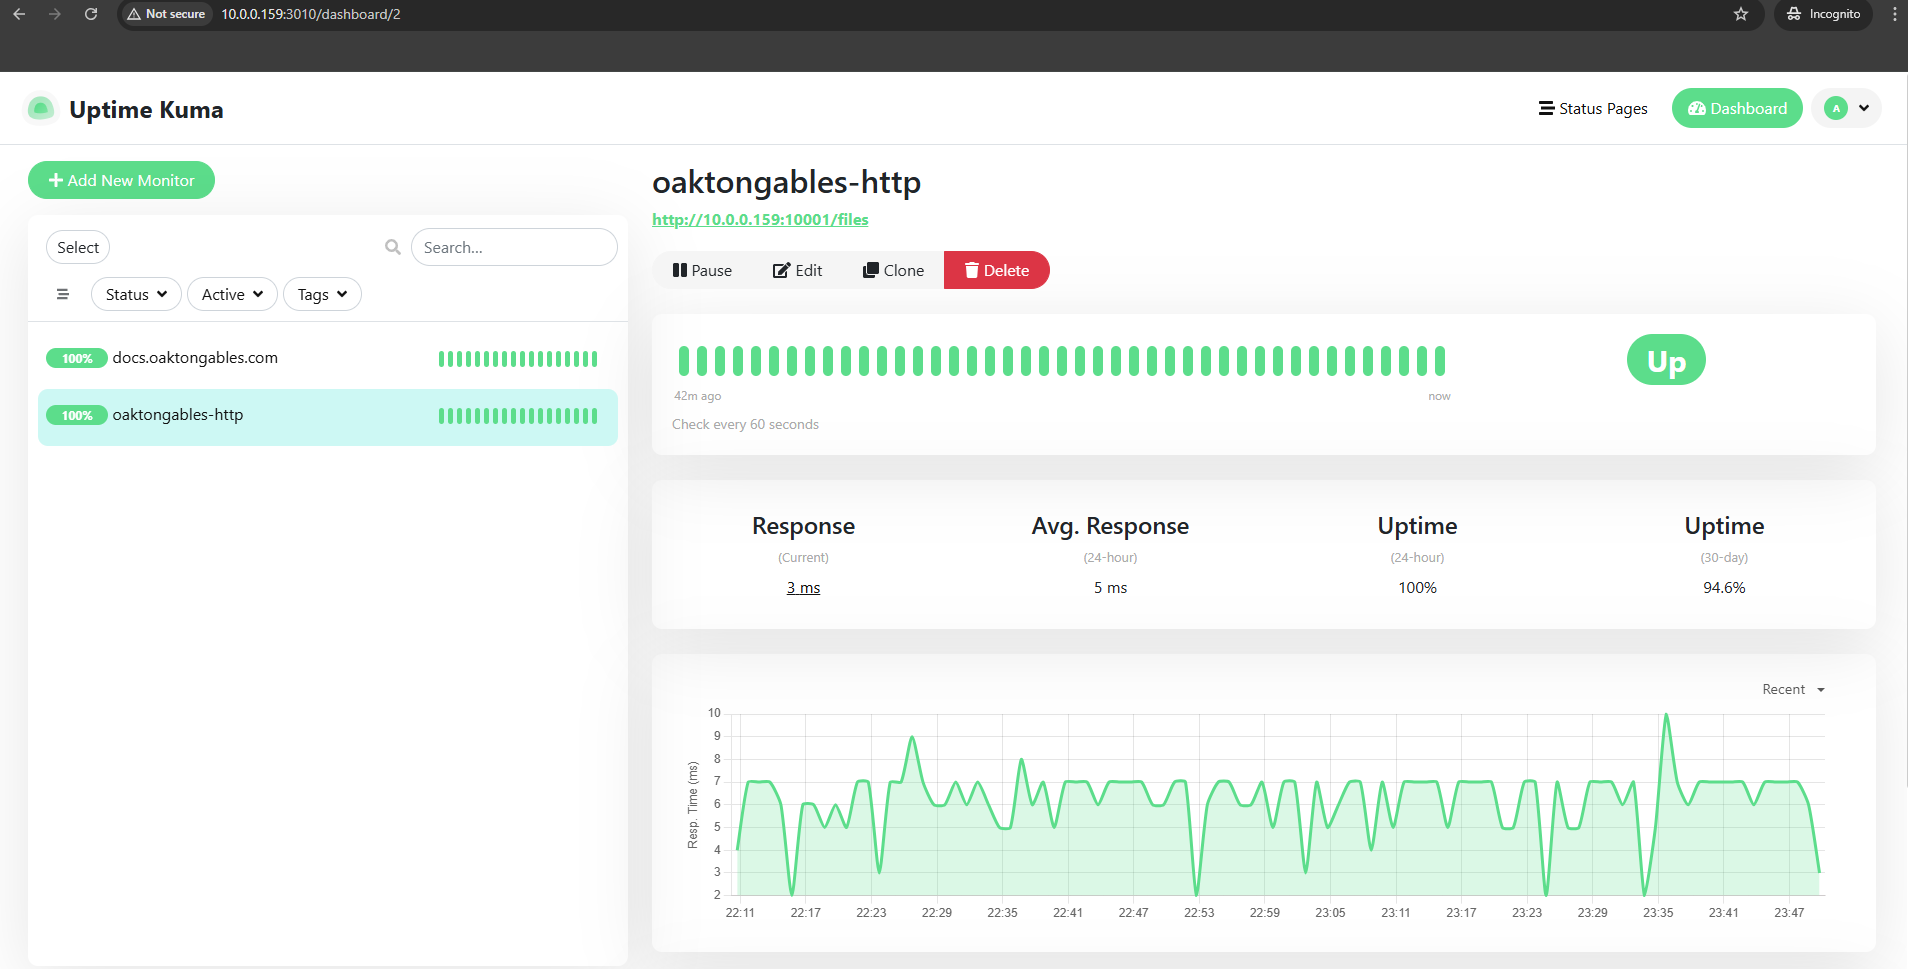
Uptime Kuma - Super easy to configure, just pings my services and lets me know if anything's down. I run it on Kubernetes now via Helm. Small tool, but super handy.
Wrap-Up
Like any homelab, mine is a constant work-in-progress. I'm always trying new tools, breaking things, fixing them (sometimes), and learning along the way. There's plenty running in the background..
The latest addition is a local AI stack with Ollama running on GPU. I use it for document processing, coding assistance in VS Code, and general chat. The full write-up is in my Local AI with Ollama on Proxmox article. Next I want to explore AI-powered log analysis: piping Grafana Loki logs into Ollama for automated incident summarization and root-cause analysis, with alerts pushed to my phone via Slack or my ntfy.